
Figures & data
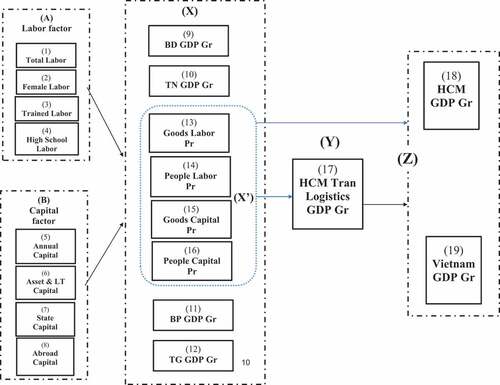
Table 1. Statistics summary of variables
Table 2. Results of the Multivariate Regression
Table 3. Kaiser-Meyer-Olkin (KMO) analysis results
Table 4. Results of factor analysis and correlation
Table 5. Wald test result
Figure 1. SEM’s estimation depiction.
Source: Study results of the authors
Table 6. RMSEA test result
Table 7. CD test result
Table A1. The SEM estimation result of direct effects, indirect effects, and total effects was processed by the expected information matrix (EIM) technique
Data availability statement
The authors, Vu Thi Kim Hanh and Nguyen Hong Nga, collected and extracted the time series secondary data manually. The data is annual and spans the years 2010–2021. https://docs.google.com/spreadsheets/d/1CbuU5OZxS8mZls0Myp6lV_zrxiMg8bIJwFyM_CL6c8U/edit?usp=sharing.