
Figures & data
Figure 1. Sovereign bond yield series graphs at first difference.
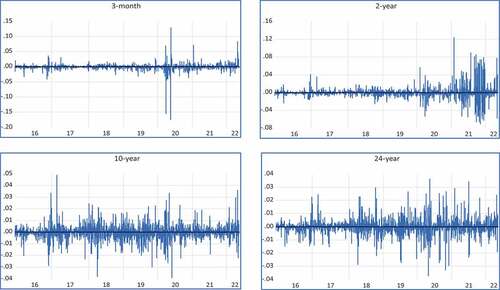
Table 1. Descriptive statistics (across maturities)
Figure 2. QQ plots of the EGARCH residuals.
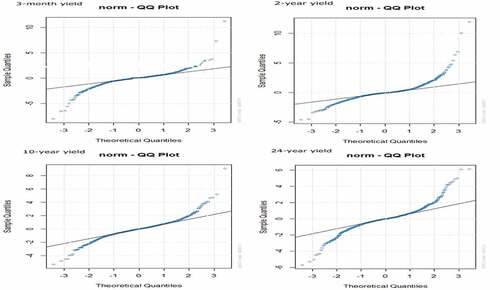
Table 2. Descriptive statistics (macro-economic indicators and sovereign yields at quarterly frequency)
Table 3. Unit root test results
Table 4. Unit root test results for macroeconomic variables
Table 5. ARCH LM test results
Table 6. EGARCH results
Table 7. Distribution selection under EGARCH
Table 8. EGARCH results during pre-COVID-19
Table 9. EGARCH results during the COVID-19 era
Table 10. Granger casualty test for the linkage between sovereign bond yield volatility and inflation
Table 11. Granger casualty test for the linkage between sovereign bond yield volatility and money market volatility