
Figures & data
Table 1. Trend of Indonesian palm oil downstream products trade (million USD)
Figure 1. The trend of Indonesian palm oil downstream trade (million USD).
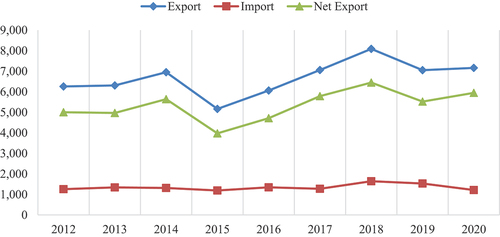
Figure 2. The matrix of sample distribution.
Table 2. Variables, description, unit, expected sign, references, and source
Table 3. Descriptive statistics
Figure 3. The Top 10 Indonesian palm downstream product export destinations
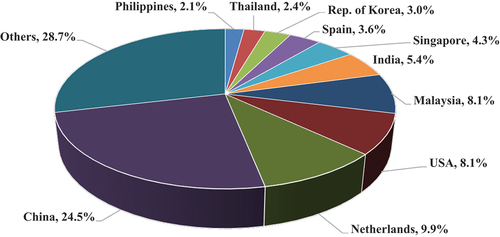
Figure 4. Export contribution of Indonesian palm oil downstream products.
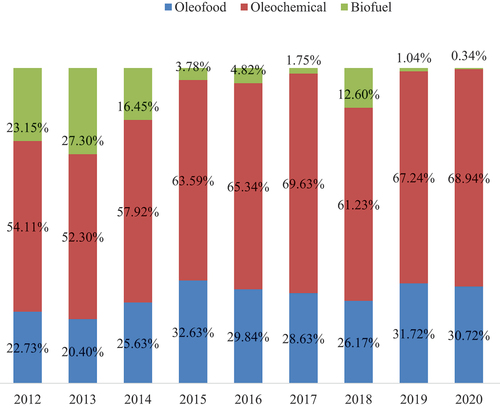
Table 4. Estimation results of palm oil downstream exports to global market
Table 5. Efficiency of Indonesian palm oil downstream export to global market
Figure 5. The trend of technical efficiency from 2012 to 2020, by Continents.
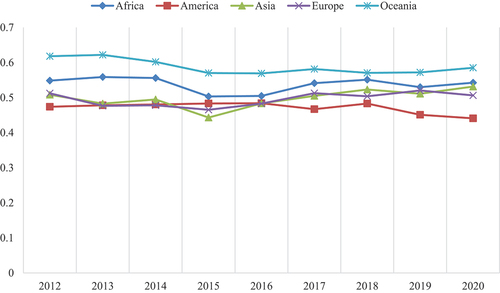
Figure 6. The trend of technical efficiency (2012–2020), by economy classifications.
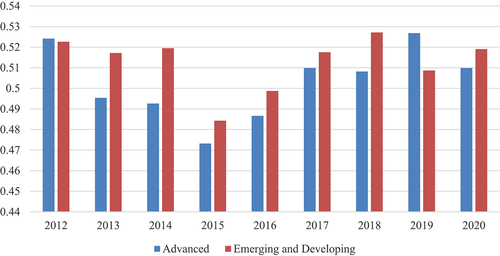
Table 6. Potential export matrix of Indonesian palm oil downstream (continents)
Table 7. Potential export matrix of Indonesian palm oil downstream (economy classification)