Figures & data
Table 1. Fee minimization
Table 2. Descriptive statistics and multiple testing results for Experiment 1
Table 3. Allocation of the $10,000 among the four fund choices
Table 4. Average concentration measures by treatments
Table 5. Subject’s self-reported responses to PEQs
Table 6. One-way ANOVA for the PEQs
Table 7. Fee minimization
Table 8. Descriptive statistics and multiple testing results for Experiment 2
Table 9. Allocation of the $10,000 among the four fund choices
Table 10. Concentration measures by treatments
Table 11. Subject’s self-reported responses to PEQs
Table 12. One-way ANOVA for the PEQs
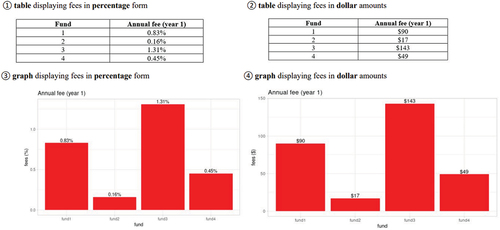
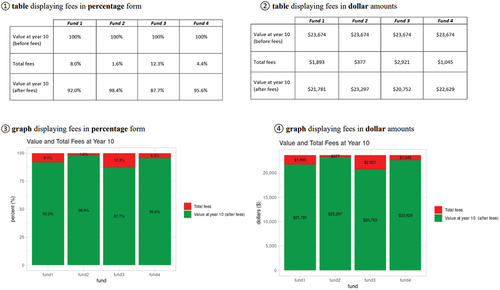
Table A2.1. Consequences and decisions for statistical tests
Table A2.2. Hypothesized response means for the 2 × 2 ANOVA for Experiment 1
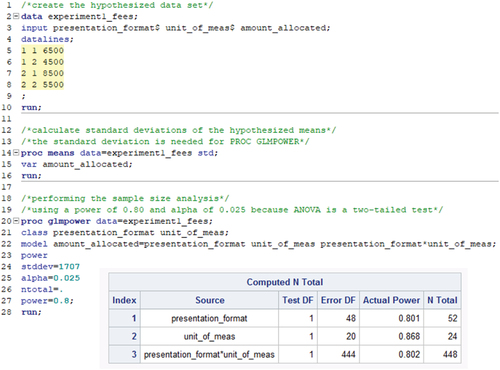
Figure A2.1. SAS code and output to calculate the required sample size for Experiment 1.