Figures & data
Figure 1. Trends of capital expenditure 1974/75–2019/20.
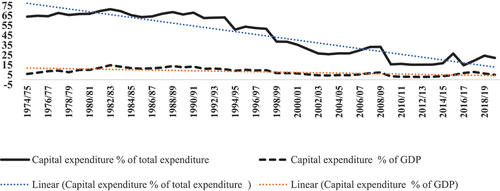
Figure 2. Capital and current expenditure (Rs. million).
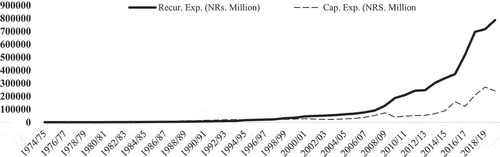
Figure 3. Capital expenditure by month for three fiscal years (%).
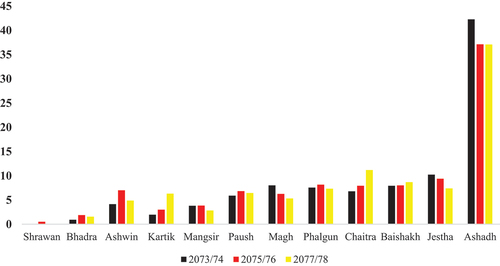
Table 1. Unit root test results at the level
Table 2. Unit root test results at the first difference
Table 3. Long-run coefficients of ARDL model, expenditure at an aggregate level
Table 4. Long-run coefficients of ARDL model, expenditure at disaggregate level-I
Table 5. Long-run coefficients of ARDL model, expenditure at disaggregate level-II
Table 6. Short-run ECM coefficients of ARDL models
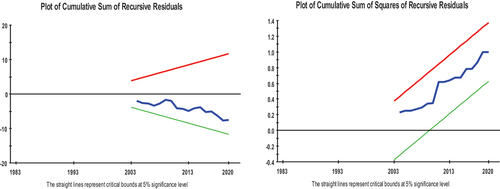
Figure C1. Plot of CUSUM and CUSUMQ plots for model specification (1).
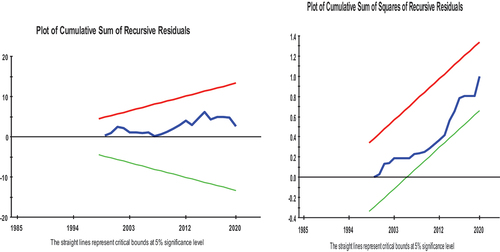
Figure C2. Plot of CUSUM and CUSUMQ plots for model specification (2).
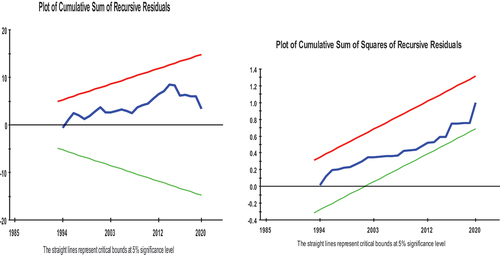
Figure C3. Plot of CUSUM and CUSUMQ plots for model specification (3).
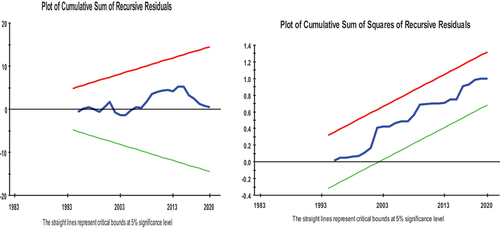
Figure C4. Plot of CUSUM and CUSUMQ plots for model specification (4).
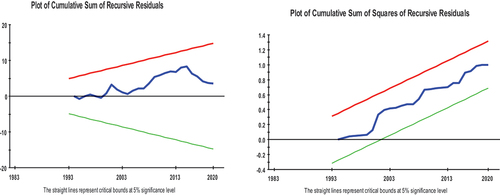
Figure C5. Plot of CUSUM and CUSUMQ plots for model specification (5).