Figures & data
Table 1. Variable description
Figure 1. The VN-index point (divided by 1000) and the BMM ratio for the market portfolio.
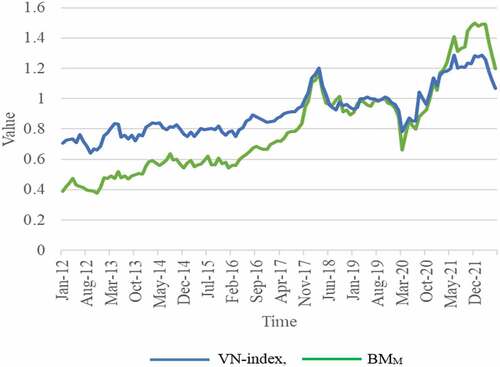
Table 2. Descriptive statistics returns in excess of the market
Table 3. Correlation between portfolios
Table 4. Regression of return premium on market excess BM ratio
Table 5. Regression results of model 2
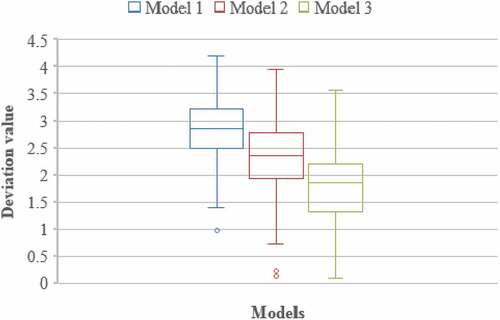
Table 6. The deviations of 3 models
Table 7. ANOVA result
Figure 2. Deviation distribution in three models.