
Figures & data
Figure 1. Evolution of youth unemployment during the period 2004–2018.
Source: (CNES Report, 2019, p. 27).
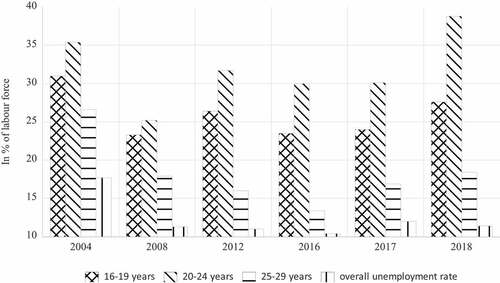
Figure 2. Evolution of unemployment rate and GDP during the period 1970 –2018.
Source: NOS (2019).
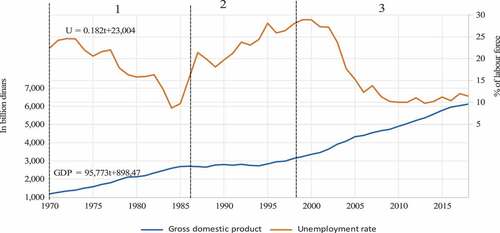
Table 1. Evolution of average unemployment rate and average economic growth rate
Figure 3. Output gap.
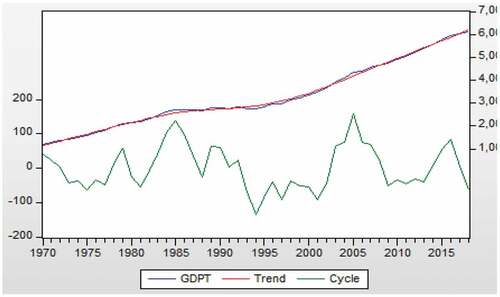
Figure 4. Unemployment gap.
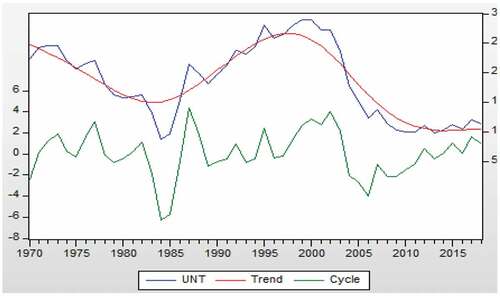
Table 2. Unit root test results
Table 3. Bounds test
Figure 5. CUSUM Test.
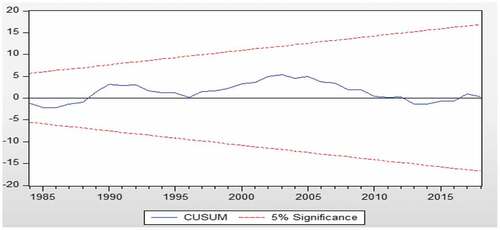
Figure 6. CUSUM of Squares Test.
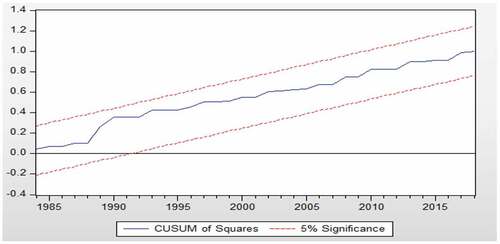
Table 4. Results of the NARDL model
Figure 7. Dynamic multipliers for Algeria.
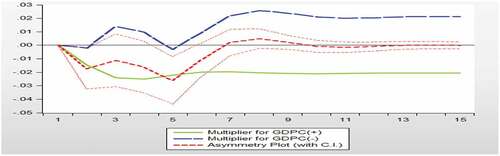
Table 5. Results of the long-run estimation