
Figures & data
Table 1. Descriptive statistics
Table 2. Pairwise Correlation Matrix
Table 3. Impact of Individual Central Bank Regulatory Policies on Market Power
Table 4. Impact of Coordinated Central Bank Regulatory Policies on Market Power
Figure 1. Marginal Plots: Coordinated Impact of Monetary and Macro-prudential Policies on Market Power.
Note: Figure shows market power (Lerner index) on the y-axis. The x-axis shows monetary policy variable. The schedules show the level at which macro-prudential influence the positive effect of monetary policy on market power (Figure ).
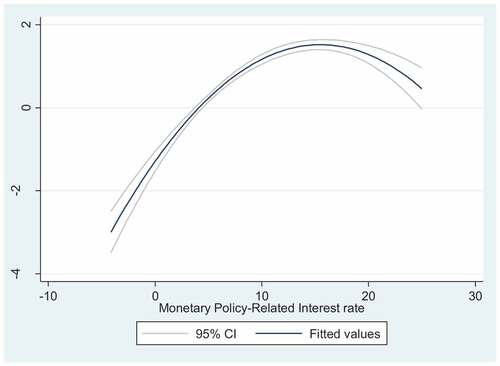
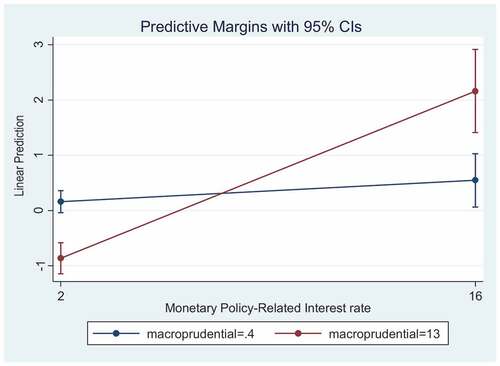
Figure 2. Marginal Plots of the Coordination of Monetary and Macro-prudential in Different CBI Framework.
Note: Market power is on the y-axis while the individual policies are on the x-axis. Steep line denotes marginal impacts of the coordination in the Stringent CBI framework while the flat line denotes impacts of the coordination in the Weak CBI framework.
Supplemental material