Figures & data
Table 1. Financing of the agricultural sector strategic recovery plan (PSRSA)
Table 2. Descriptive statistics of the main variables
Table 3. Socioeconomic characteristics of producers according to access to credit
Figure 1. Access to credit by region and average regional yield by access to credit.
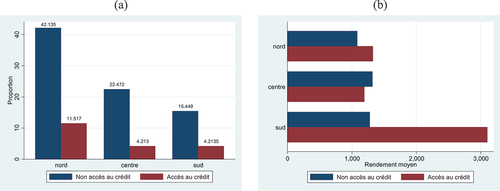
Table 4. Estimation of the endogenous switching regression model
Figure 2. Kernel density of the logarithm of yield according to access to credit. (Source: Author based on estimating results).
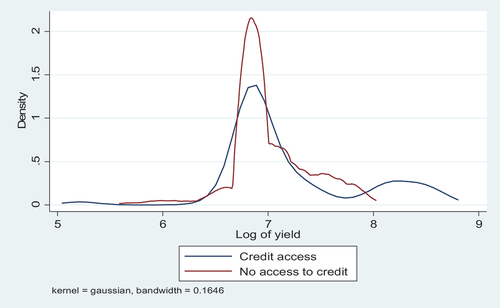
Table 5. Productivity difference according to access to credit or not
Table 6. Capital productivity difference according to access to credit or not
Table A1. Definitions and measures of study variables
Table A2. Estimation of the endogenous switching regression model
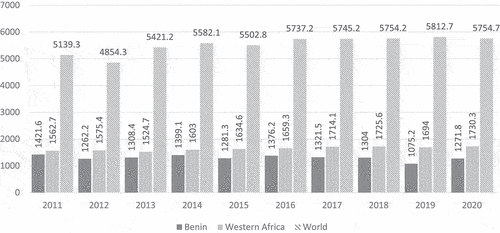
Figure A1. Maize yield from 2011 to 2020 (Kg/ha).
Source: Authors from FAOSTAT data (2022)