Figures & data
Figure 1. Top Ten NTAE products growth in percentage terms in 2019 Relative to 2018 Figures. Source: Authors’ estimation from GEPA (Citation2019) Statistics.
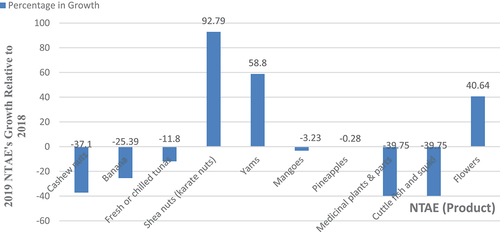
Figure 2. Top Ten NTAE products contributions to overall merchandized exports in 2019. Source: Authors’ estimates from GEPA (Citation2019) Statistics.
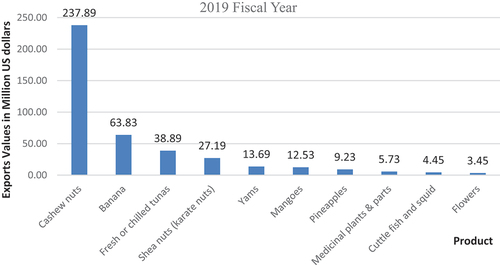
Table 1. Explanatory variables and their a prior expectations
Table 2. Trend analysis for NTAE-Least Squares method
Table 3. Unit root test
Table 4. ARDL bounds test approach to cointegration
Table 5. Short-run factors that affect the growth of NTAE based on ARDL model
Table 6. Results of ARDL error correction model
Table 7. Factors affecting the growth of NTAE in the long run
Table 8. Diagnostic test results
Figure 3. CUSUM test graph.
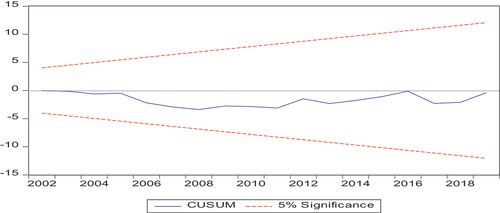
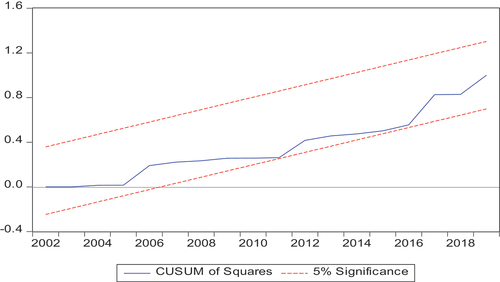
Figure 4. Graph of CUSUM squares.