
Figures & data
Table 1. Percentage of Urban population in 2007 and projected percentages, 2017–37
Table 2. Population trend in large and medium towns of the regional state
Figure 1. Conceptual frame work for impacts of urban expansion.
Figure 2. Map of the study areas.
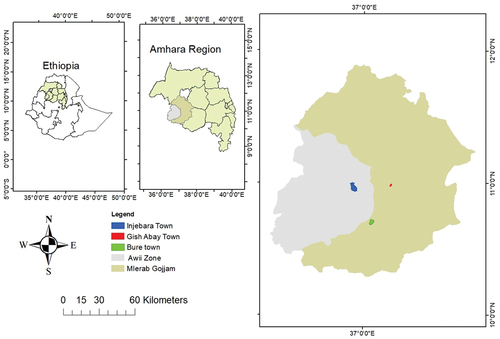
Table 3. Distribution of sample households by municipalities
Table 4. Definition and measurement of independent variables
Table 5. Demographic and socio-economic characteristics of the households
Table 6. Descriptive statistics of mean annual income by eviction status
Table 7. Endogenous switching regression model output of household income
Table 8. Summary of predicted values for total income for evicted and non-evicted