
Figures & data
Table 1. Description, unit of measurement, and expected signs of the explanatory variables in the models
Table 2. Disaggregated descriptive statistics by market participants and non-participants
Figure 1. Percentage distribution of households’ market participation index (HMPI).
Source: Field survey (2018).
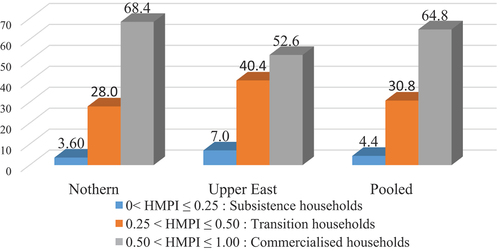
Table 3. Determinants of households’ decision to participate in groundnut market: A probit regression model (PRM)
Table 4. Determinants of level of HMPI: A generalized linear model