Figures & data
Table 1. A summary table of the DCC model parameter estimates between the S&P500 and Bitcoin
Figure 1. Estimated conditional correlation using DCC GARCH between S&P500 (developed equity market) and Bitcoin (cryptocurrency).
Table 2. A summary table of the DCC model parameter estimates between the MSCI and Bitcoin
Figure 2. Estimated conditional correlation using DCC GARCH between MSCI (emerging equity market) and Bitcoin (cryptocurrency).
Figure 3. Correlation of S&P500 and Bitcoin at different time scales.
Figure 4. Cross-correlationsbetween the return series of S&P500(developed equity market) and Bitcoin (cryptocurrency market).
Figure 5. Direction of arrows and their meaning.
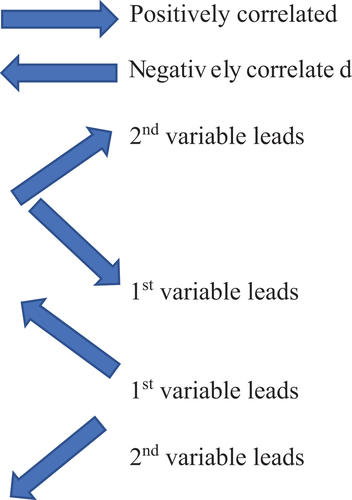
Figure 6. Wavelet coherence between S&P500 (developed equity market) and Bitcoin (cryptocurrency market). Directions of arrows and their meaning: → positively correlated, ←negatively correlated, ↗ 2nd variable (BTC) leads, ↘1st variable (S&P500) leads, ↖1st variable (S&P500) leads, and ↙2nd variable (BTC) leads.
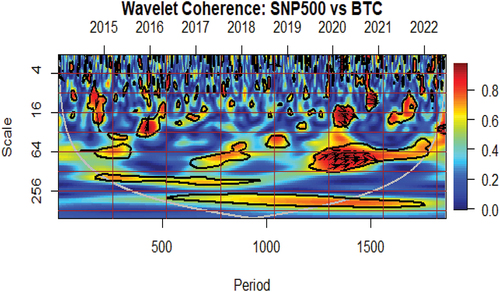
Figure 7. Correlation of MSCI (emerging equity market) and Bitcoin (cryptocurrency market) at different time scales.
Figure 8. Cross-correlation between the return series of MSCI (emerging equity market) and Bitcoin (cryptocurrency market).
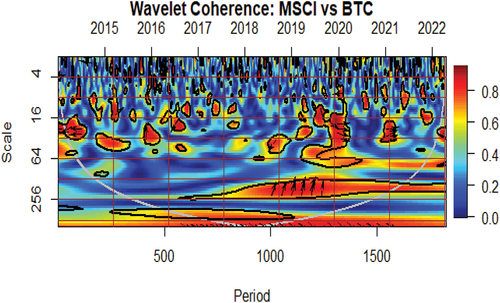
Figure 9. Wavelet coherence between MSCI (emerging market) and Bitcoin (cryptocurrency market). Directions of arrows and their meaning: → positively correlated, ← negatively correlated, ↗ 2nd variable(BTC) leads, ↘1st variable(MSCI) leads, ↖ 1st variable (MSCI) leads, and ↙2nd variable (BTC) leads.