
Figures & data
Table 1. Descriptive statistics
Table 2. Stationarity tests
Figure 1. Scatter plot and fitting curve.
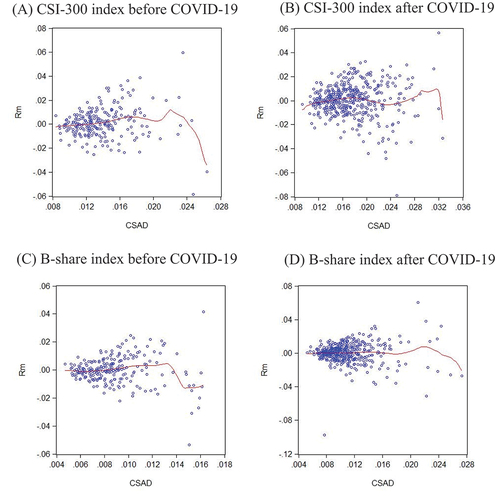
Table 3. Regression results of herding behavior before and during COVID-19
Table 4. Impact of herding behavior on market volatility
Table 5. Regression results in bear and bull markets
Table 6. Order of autoregressive model—information criterion
Figure 2. Time trends of CSAD.
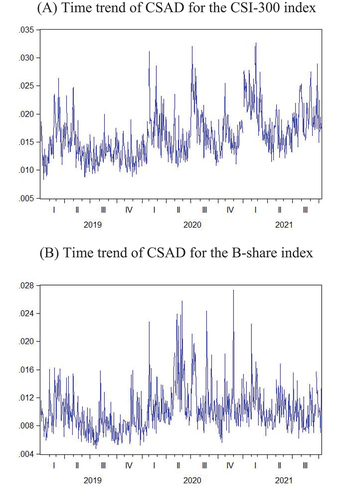
Table 8. Threshold GARCH model
Table 7. OLS vs. E-GARCH models