
Figures & data
Figure 1. Trend analysis of foreign capital inflow between 2010 and 2020 in million of US Dollars.
Source: Author’s plot from CBN Statistical Bulletin (Citation2020).
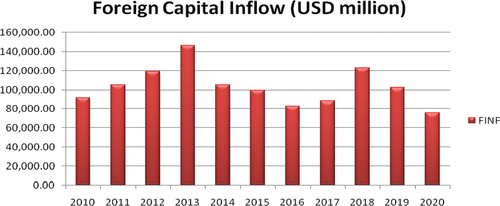
Table 1. Descriptive outcomes
Table 2. Unit roots test result
Table 3. Discrete threshold specification test
Table 4. Bai-Perron Multiple Thresholds Test
Table 5. Summary of discrete threshold regression result