
Figures & data
Figure 1. Graphical presentation of the data set.
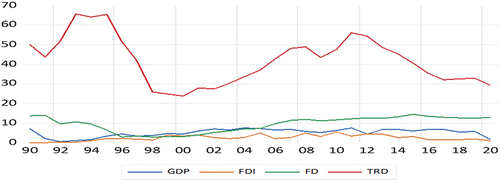
Table 1. Descriptive statistics of the variables
Table 2. Vector autoregressive lag order selection based on Akaike information criterion
Table 3. Results of unit root (stationarity) status
Table 4. ARDL bounds (F-test) test for cointegration
Table 5. Results for long-run estimates of the ARDL approach
Table 6. Results of the short-run dynamics and the error correction model (ECM)
Figure 2. Model stability test CUSUM (EquationEquation 5(5)
(5) ).
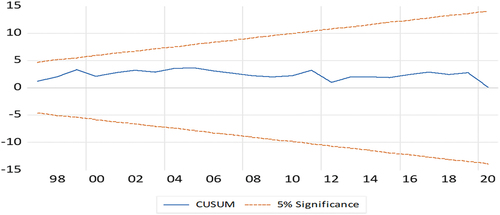
Figure 3. Model stability test CUSUM of squares (EquationEquation 5(5)
(5) ).
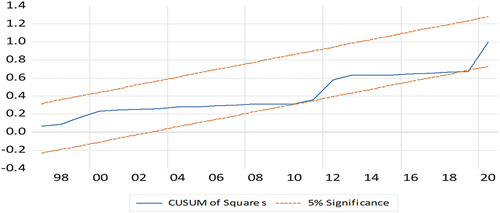
Table 7. Test for serial correlation and heteroscedasticity
Data availability statement
World Bank Group (2022), World Bank national accounts data, and OECD National Accounts data files are available online at https://data.worldbank.org/indicator/.