
Figures & data
Figure 1. Share of the Islamic banking industry in the overall banking industry.
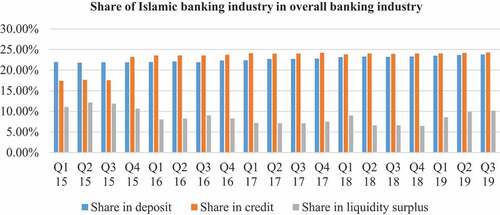
Table 1. Summary of the literature showing the relation of the liquidity and credit risk with bank performance
Table 2. Efficiency and its determinants around the world
Table 3. Inputs and outputs considered in this paper
Table 4. Description of independent variables
Figure 2. Overall TE, PTE, and SE Bangladeshi Islamic banks, 2007–2018.
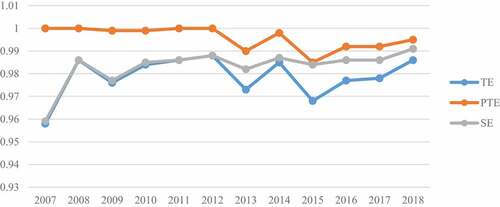
Table 5. Bangladeshi Islamic banks’ RTS for 2007 = 2018 (percentage share)
Table 6. Breusch-Pagan/Cook–Weisberg test for heteroscedasticity
Table 7. Model 1 shows the Multivariate regression analysis models considering TE as the dependent variable
Table 8. Model 2 shows the Multivariate regression analysis models considering PTE as the dependent variable
Table 9. Model 3 shows the Multivariate regression analysis models considering SE as the dependent variable
Table 10. Impact of liquidity risk and credit risk on TE (checking robustness and removing endogeneity)
Table 11. Impact of liquidity risk and credit risk on PTE (checking robustness and removing endogeneity)
Table 12. Impact of liquidity risk and credit risk on SE (checking robustness and removing endogeneity)
Table 13. Hausman (Citation1978) specification test