
Figures & data
Figure 1. Research framework.
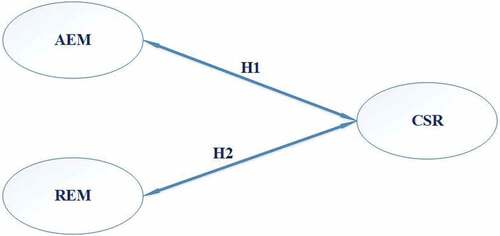
Table 1. Sample collection
Table 2. Descriptive statistics of variables
Table 3. Pearson’s correlation coefficient matrix
Table 4. The OLS and FE regression models used to assess Granger causality between AEM and CSR (H1a)
Table 5. The OLS and FE regression models used to assess Granger causality between CSR and AEM (H1b)
Table 6. The OLS and FE regression models used to assess Granger causality between REM and CSR (H2a)
Table 7. The OLS and FE regression models used to assess Granger causality between CSR and REM (H2b)
Table 8. Bootstrap test analysis
Table 9. Robustness results for testing all hypotheses
Table 10. 2SLS results for hypothesis H1a and H2a
Table 11. 2SLS results for hypothesis H1b and H2b
Table 12. FsQCA findings regarding CSR-EM relationship
Table 13. FsQCA results in terms of EM-CSR relationship
Table