
Figures & data
Table 1. Frequency counts of the dependent variable
Table 2. Descriptive statistics
Table 3. The selection of variables
Table 4. Logistic regression results for the LASSO-based model
Table 5. The comparison between our model and Altman Z”-score model – Logistic regression
Figure 1. Normalized confusion matrix (%).
Notes: We compare the classification accuracy between our model with the Altman Z”-score model. The vertical axis represents the actual classification value, while the horizontal axis represents the predicted value through logistic regression. The upper left of the graph indicates the proportion of distressed firms correctly classified as distressed. In contrast, the lower right of the graph indicates the proportion of non-distressed firms correctly classified as non-distressed.
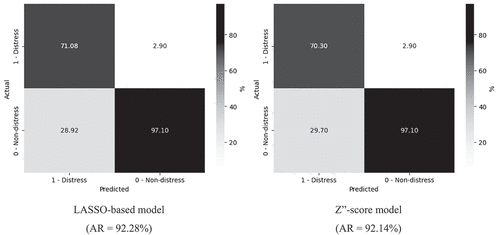
Figure 2. The area under the receiver operating characteristic curve (AUC).
Notes: We compare the predictive performance between our model with the Altman Z”-score model. AUC denotes the area under the receiving operating characteristic curve measuring the model’s predictive performance.
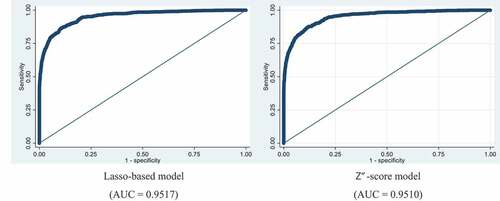
Table 6. Industry-level analysis during the Covid-19 pandemic