
Figures & data
Figure 1. Map of the study area.
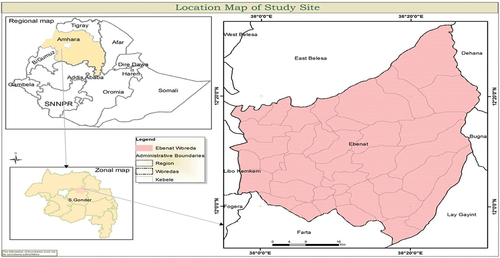
Figure 2. Household food shortage experience.
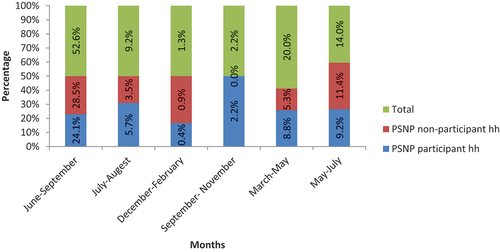
Figure 3. Coping strategy for food insecurity.
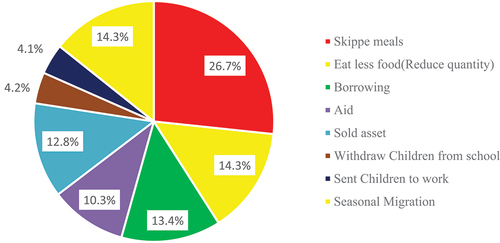
Table 1. Logistic regression result for propensity score estimation
Figure 4. Kernel density distribution of propensity scores.
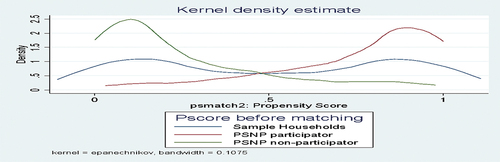
Table 2. Distribution of estimated propensity scores
Table 3. Impacts of Program Safety Net Program on beneficiary households