
Figures & data
Table 1. Description of variables
Table 2. Descriptive Statistics
Table 3. AUGMENTED DICKEY-FULLER UNIT-ROOT TEST
Table 4. Correlation matrix
Table 5. Granger Causality Tests
Table 6. Selection-order criteria
Table 7. Bound test
Table 8. Cointegration test
Table 9. Estimation of eq 1 with the cls method (K threshold variable from 7 to 15)
Chart 1. The Evolution of the residual sum of square according to the level of inflation dummy variable
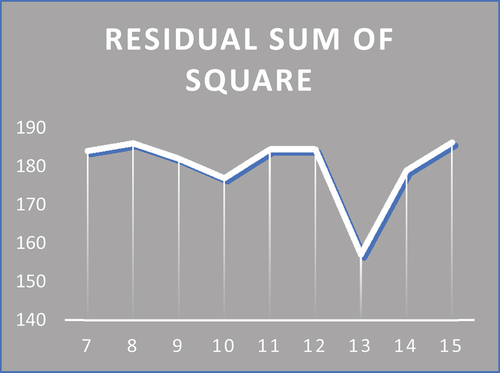
Chart 2. The evolution of the residual sum of square the R square according to the level of inflation dummy variable
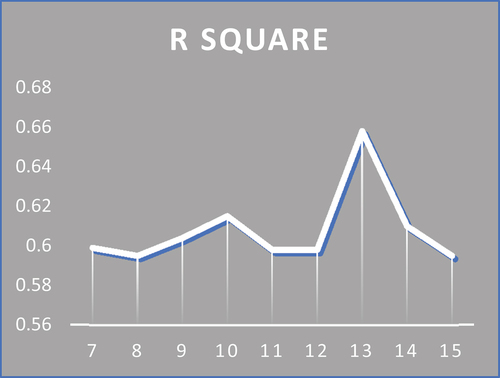
Table 10. Two stage least square (2sls) estimation