
Figures & data
Table 1. Key activities with impact on government revenue and expenditure
Table 2. Preliminary statistics of variables
Table 3. Correlation matrix
Figure 1. Time series plot of fiscal indicators.
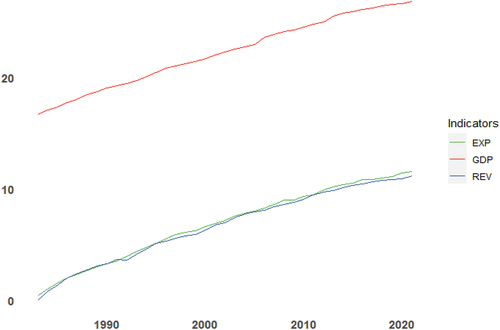
Figure 2. Co-movement between expenditure (EXP) and revenue (REV).
An approximate cycle of 10 observations representing 10 years was utilised in this study. The first (2.828427), second (5.656854), and third (11.313708) scales indicating an approximate 10-year cycle of short-, medium-, and long-terms, respectively, were considered for this investigation.
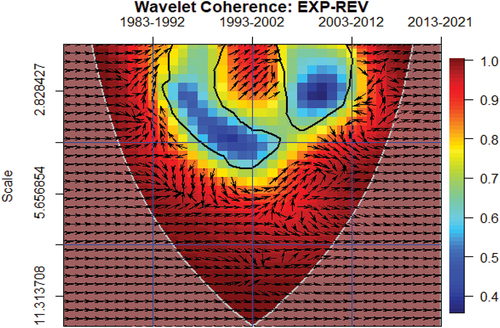
Figure 3. Conditional effect of GDP on the nexus between expenditure (EXP) and revenue (REV).
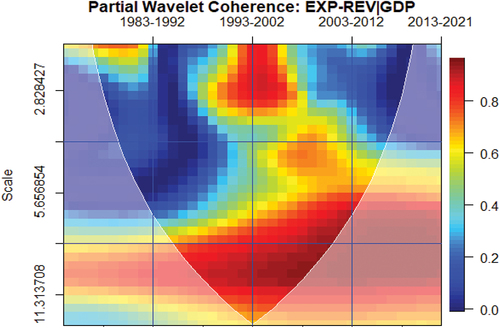
Figure 4. Bivariate contemporaneous analysis.
C1, C2, and C3 denote the natural logarithm of revenue, expenditure, and GDP, respectively.
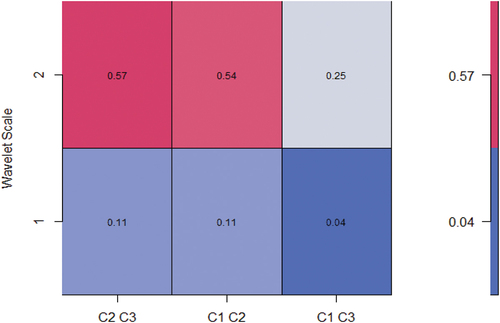
Figure 5. Wavelet multiple correlations among expenditure, revenue and GDP. U-upper limits, L- lower (at 95% confidence interval).
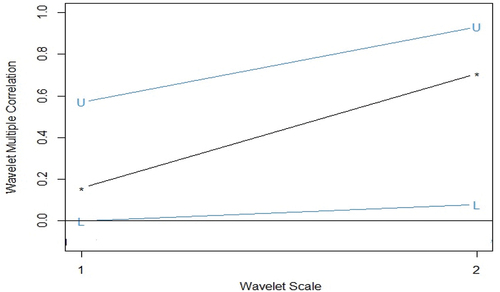
Table 4. Wavelet Multiple Correlations (WMC)
Figure 6. Wavelet multiple cross-correlations among expenditure, revenue and GDP.
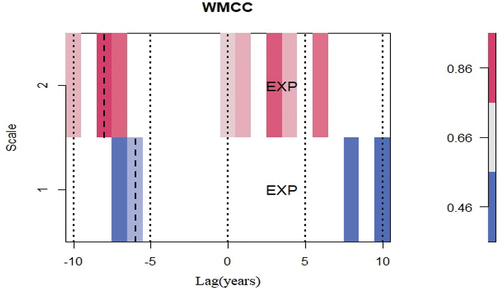
Table 5. Wavelet Multiple Cross Correlations (WMCC)
