Figures & data
Table 1. Summary of the PI indicators
Table 2. KMO and bartlett’s test
Figure 1. Scree plot.
Table 3. Factor-loading matrix and unique variances estimates
Table 4. Descriptive statistics of the selected monthly inflations by country
Table 5. An overview of three country-specific conditional variance specifications and the best fitted model
Table 6. Summary statistics for key variables
Table 7. Correlation matrix
Table 8. The impact of PI on IV
Table 9. The impact of PI on IV controlling for broad money
Table A1. List of Economic variables are used, definitions and sources
Table A2. List of political indicators used, definitions, and sources
Table A3. List of the MENA countries included in the study
Table B1. The Impact of PI on IV Using Standard Deviation of Inflation as Measure of IV
Table B2. The Impact of PI on IV with annualised IV by using Beta lags (MIDAS weight)
Table B3. The impact of PI on IV from a General Model to Specific Model
Figure C1. Inflation rate for the MENA region versus the rest of the World.
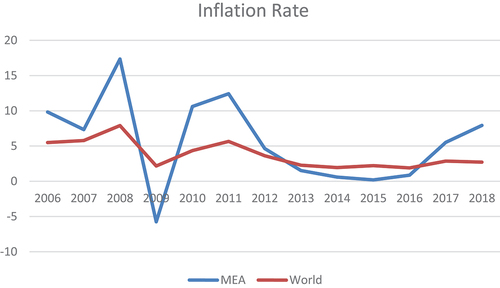
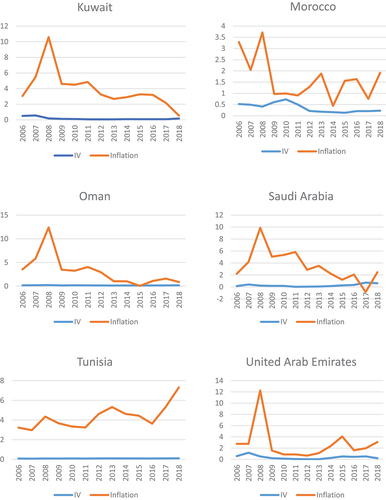
Figure C2. Inflation and IV graph for each country.
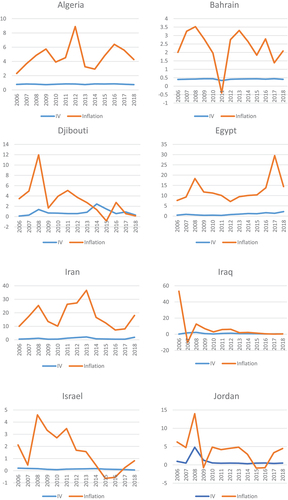
Figure C2. Continued.