
Figures & data
Figure 1. Map of the study area (Hulet Eju Enesie district).
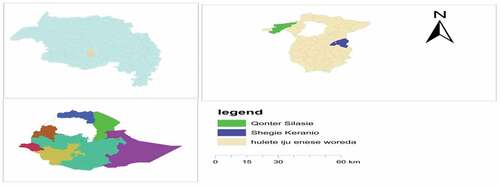
Table 1. Proportional sample distribution for each Kebeles
Table 2. Summary of independent variable and their hypothesized relationship
Figure 2. Conceptual framework, own design (2020).
Table 3. The Summary of t-test statistics for continuous variables
Table 4. Statistical summary of chi-square test for categorical and dummy variables
Table 5. Estimation result of first hurdle (probit regression) on farmers’ participation in SSI
Table 6. Estimation result of second hurdle (truncated regression) for extent of farmers’ participation in SSI