Figures & data
Figure 1. Customers’ demands for financial services are categorized into segments for conventional technology and emerging ones.
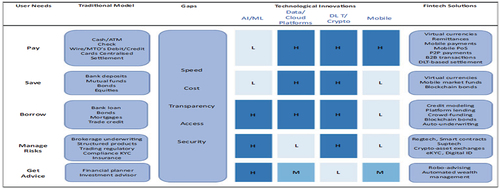
Table A1. The distribution of the overall study sample according to their demographic characteristics
Figure A1. The distribution of the overall study sample according to gender.
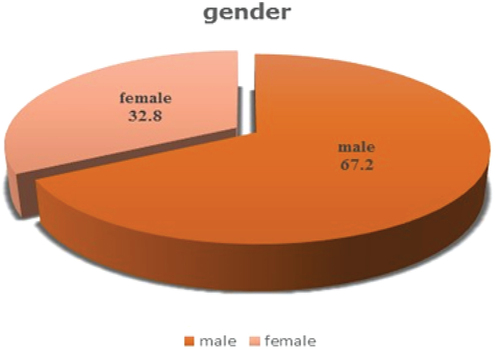
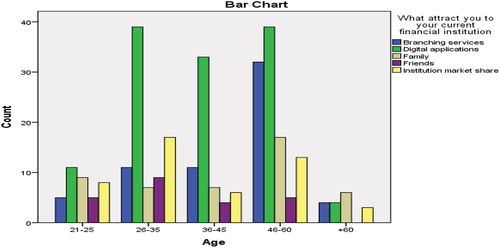
Figure A2. The distribution of the overall study sample according to age.
Figure A3. The distribution of the overall study sample according to nationality.
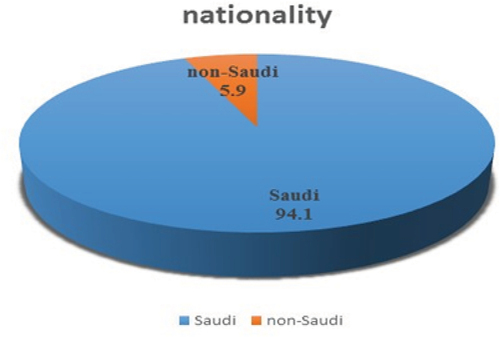
Figure A4. The distribution of the overall study sample according to education level.
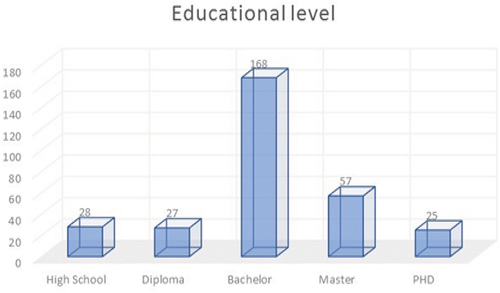
Figure A5. the distribution of the overall study sample according to work in the financial institution.
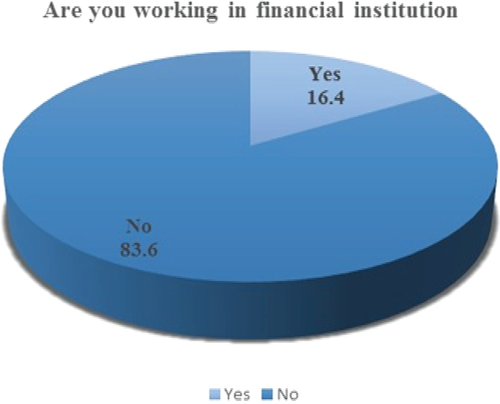
Figure A6. The distribution of the overall study sample according to job level.
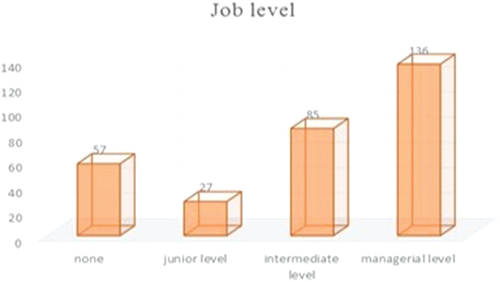
Figure A7. The distribution of the overall study sample according to years of experience.
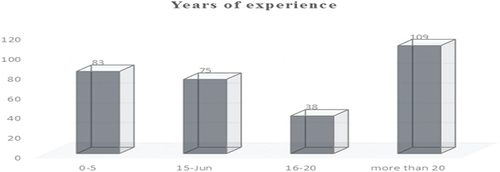
Table A2. How does Fintech attract consumers to a specific financial institution?
Table A3. Summary for Chi square test: At 5 % level of significance (0.05) Education Level
Figure A8. Characteristics of Participants, frequencies and percentages.
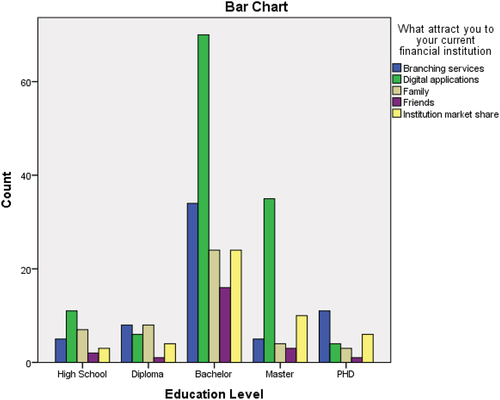
Table A4. Summary for Chi square test: At 5 % level of significance (0.05) Job level
Figure A9. Characteristics of Participants, frequencies and percentages.
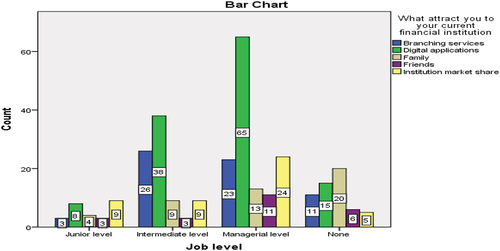
Table A5. Summary for Chi square test: At 5 % level of significance (0.05) Age
Figure A10. Characteristics of Participants, frequencies and percentages.