Figures & data
Figure 1. The interlinkages among CGQ, FRQ and firm performance.
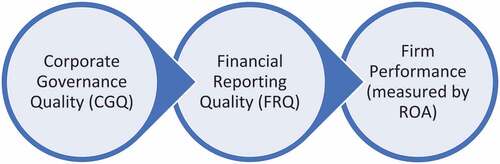
Figure 2. The mediating role of FRQ in the CGQ and firm performance relationship.
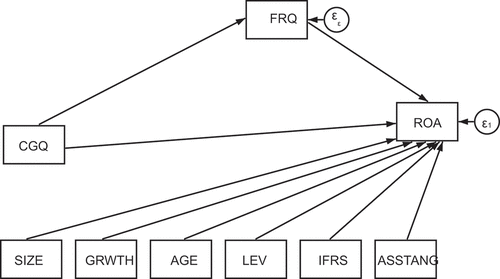
Table 1. Sample selection
Table 2. Measurement of variables used in the study’s models
Table 3. Descriptive statistics
Table 4. Correlation coefficients
Table 5. Baseline static and dynamic regression results of firm performance (i.e., ROA) determinants
Table 6. Static and dynamic regression results of firm performance (i.e., Tobin’s Q) determinants for robustness checks
Table 7. Causal mediation analysis output for the study’s outcome model with mediator
Table 8. Causal mediation analysis output for the study’s mediator model
Table 9. The estimates of causal effect of CG on firm performance mediated by FRQ
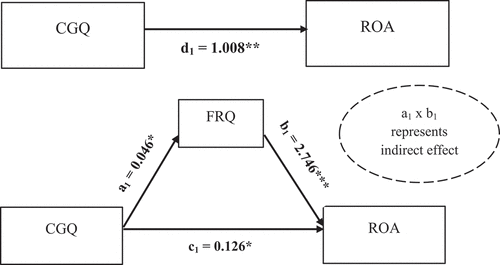
Figure 3. Path analysis: Corporate governance, earnings management, and firm performance.