Figures & data
Table 1. Descriptive statistics of forecast errors
Table 2. Absolute forecast error, |(At – Ft,h)| = a + b1(recession dummy) + b2(horizon)
Table 3. Information rigidity: Tests based on forecast error, 6M revision At – Ft,h = a0 + a1Rt,h+k + et,h
Table 4. Information rigidity: Tests based on forecast error, 3M revision At– Ft,h = a0 + a1 Rt,h+k + et,h
Table 5. Information rigidity: Tests based on forecast revision Rt,h = b0+ b1Rt,h+k+ et,h
Table 6. Information rigidity during recession period (Jan. 2007 to Dec. 2012) Rt,h = b0 + b1 Rt,h+k+ et,h
Table 7. Information rigidity during recession using recession period as dummy Rt,h = b0 + b1 Rt,h+k+ b2D + b3D*Rt,h+k + et,h
Table 8. Absorption of domestic and foreign news: VAR approach
Table 9. Variance decomposition by generalized decomposition
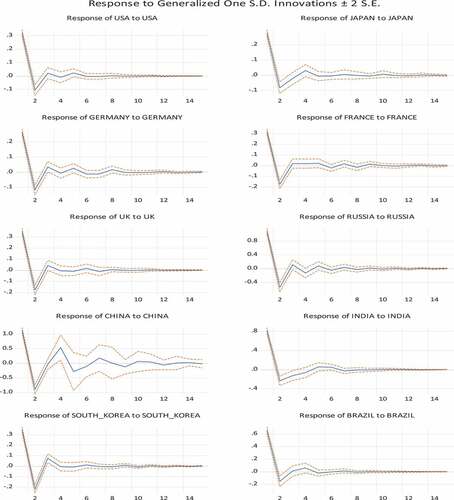
Figure 1. Generalized impulse responses of forecast revisions: own-country responses. (In percentage points, with two standard deviation confidence bands.).