Figures & data
Figure 1. Average real total factor productivity 1954–2019.
Source: Calculated from the Federal Reserve Bank of St. Louis data
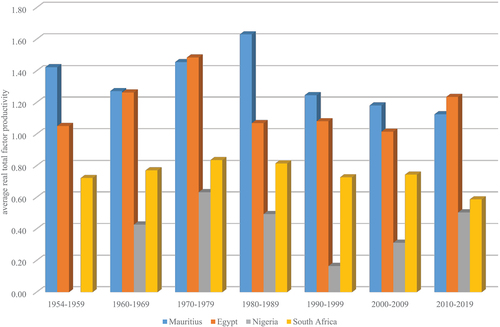
Figure 2. Structure of R&D capital spending and total factor productivity in South Africa.
Source: Plotted from South African Reserve Bank, and Federal Reserve Bank of St. Louis data
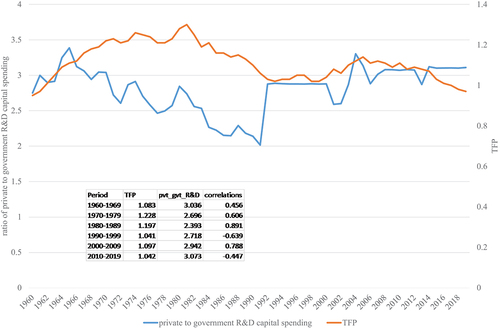
Table 1. Definition of variables and measurement
Table 2. Summary statistics
Table 3. Correlation analysis
Table 4. Unit root tests based on Augmented Dickey–Fuller procedure
Table 5. Regression results for OLS, ARDL, and NARDL models
Table 6. Error correction model results
Figure 3. Non-linear ARDL model multiplier analysis.
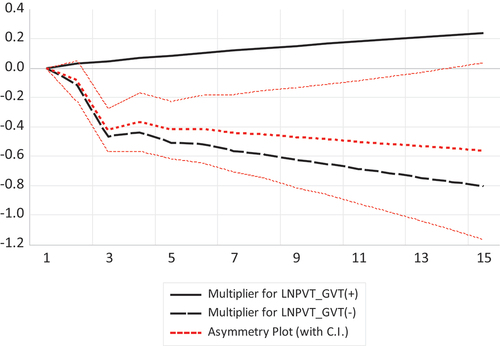
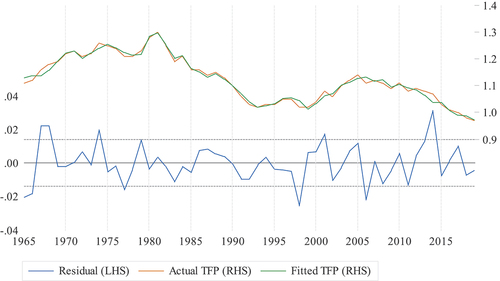
Figure 4. Examination of predicted versus actual TFP and the structural residuals for the non-linear ARDL model.
Source: Author’s analysis