
Figures & data
Figure 1. The relationship between EPU, corporate leverage and cash holdings.
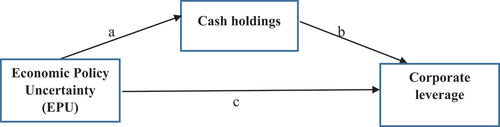
Figure 2. The plot of News-based EPU, 3-component-based EPU and GEPU indexes over the sample period (1995–2018) .
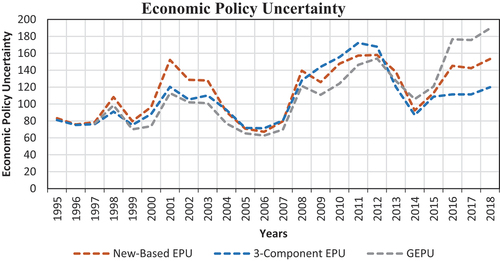
Table 1. Descriptive statistics
Figure 3. Economic policy uncertainty and average corporate leverage behaviour over 1995–2018.
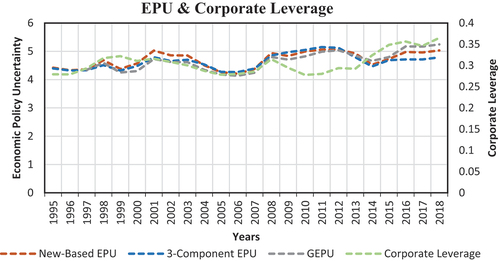
Figure 4. Economic policy uncertainty and average cash holdings behaviour over 1995–2018.
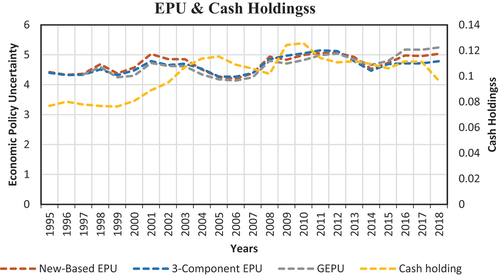
Figure 5. Average corporate leverage and average cash holdings behaviour over 1995–2018.
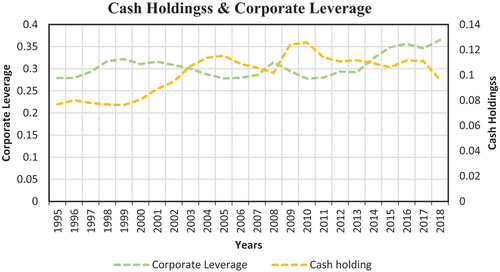
Table 2. Baseline results
Table 3. Heterogeneous analysis
Table 4. Robustness checks 1 & 2: Excluding corporate leverage observations greater than one and alternate measure of cash holdings
Table 5. Robustness check 2: Alternative EPU measures
Table 6. Robustness checks 3 and 4: Mitigating endogeneity concern and sample selection bias
Table 7. Additional test: Substituting long-term and short-term leverage with total leverage
Data availability statement
The data used in this study was obtained from Thomson EIKON Datastream (URL https://eikon.thomsonreuters.com), a paid data provider and (URL: http://www.policyuncertainty.com/index.html) am open source data.