
Figures & data
Figure 1. Evolution of inward FDI flows in Côte d’Ivoire as % of GDP.
Source : The graph has been plotted from the WDI database (WDI, Citation2021)
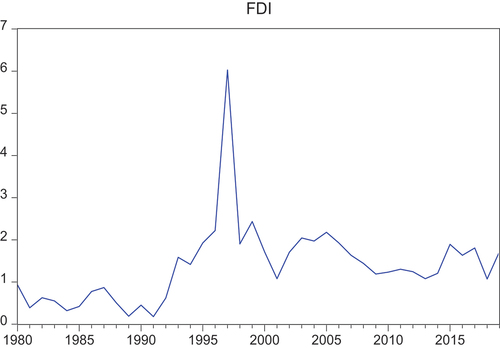
Table 1. Foreign direct investment by sectors (as share of total FDI inflows)
Table 2. Description of variables
Table 3. Summary statistics
Table 4. Pearson’s correlation matrix
Table 5. Results of Toda-Yamamoto causality test
Table 6. Results of ADF and PP unit root test (with intercept and trend)
Table 7. Results of ZA unit root test (with intercept and trend)
Table 8. Results of lag order selection criteria
Table 9. ARDL bounds test results for cointegration
Table 10. Short-run estimates
Table 11. Long-run estimates
Figure 2. Graph of CUSUM.
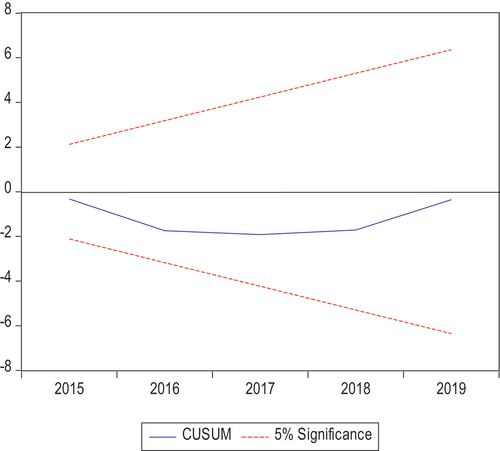
Figure 3. Graph of CUSUMSQ.
Note: the straight lines represent critical bounds at 5% significance level
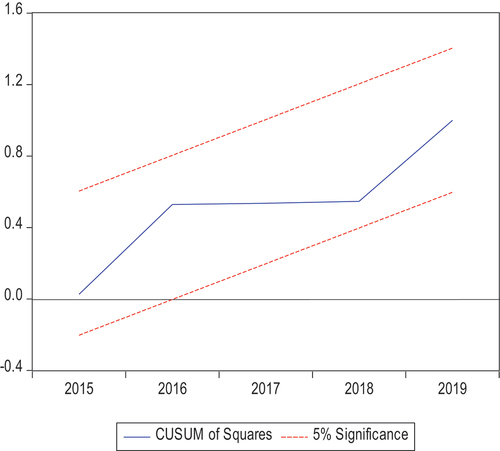
Table 12. ARDL model long-run diagnostic tests
