
Figures & data
Figure 1. Market structure banking system structure play important role to contain the systemic risk. Heterogenous market make banking system sounder to financial shocks.
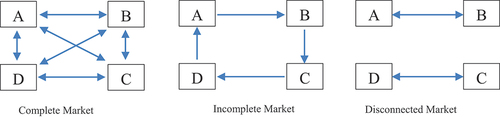
Table 1. Basel adjusted indicators. Basel allow domestic policy maker to adjust the indicators to capture country banks characteristics
Table 2. Sample banks the banks are classified based on core capital of which determine its operational activities
Table 3. Summary statistic daily returns. The results derived by STATA using daily share price data
Table 4. Returns correlation reflect the co-movement of share price and early indication of interconnectedness in the system
Figure 2. Principal component analysis.
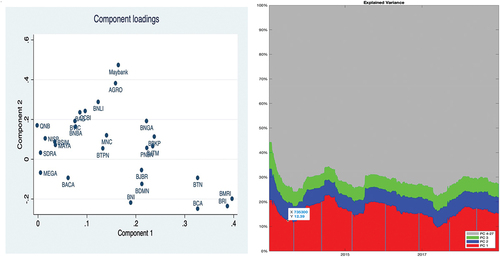
Table 5. Principal component (Eigenvectors) − 15 components escalation proportion delivers intercorrelated exposures. The table exhibit the dominance of big banks in the Indonesia financial system
Table 6. Granger causality lag (1) and (8) sample. Describe the interactions across different time lags (full results available upon request)
Figure 3. Centrality measures. Picture of banks network centrality across different measures.
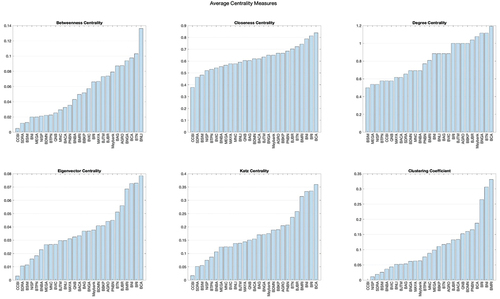
Figure 4. Network matrix and interconnectedness. Show a bank importance and connection to other banks in the system wide.
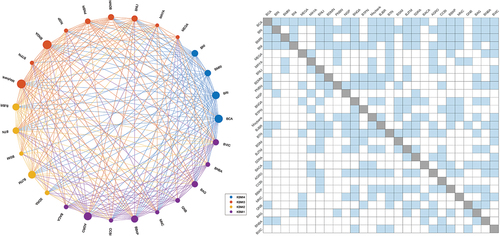
Figure 5. Connection indicator. The graph produced using Matlab software where reflects the connection coming from banks peer.
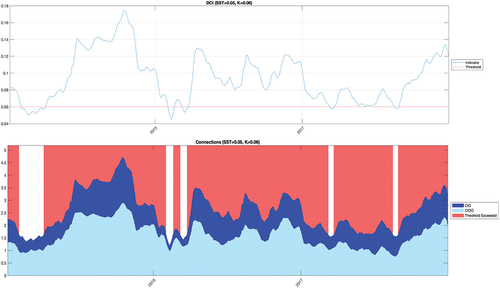
Table 7. Spillover 5 Banks. It shows the magnitude and risk direction over time
Table 8. Basel indicator-based (Top ten banks). Results are sorted by the interconnectedness score
Table