
Figures & data
Figure 1. Gini coefficient and growth rate of real GDP of South Africa for the period 1989 to 2018.
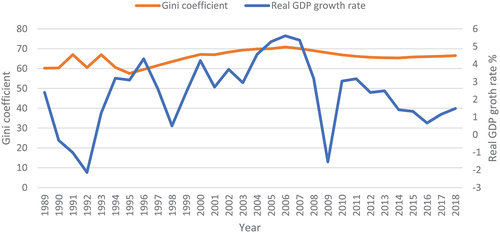
Figure 2. Gini index of upper-middle-income countries for 2018.
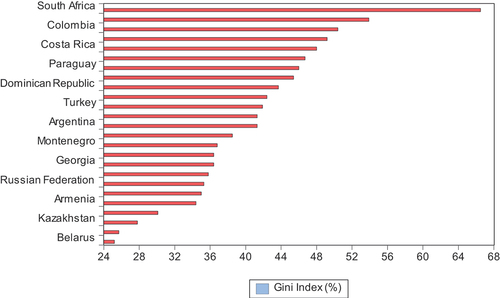
Table 1. Summary of empirical studies on the relationship between income inequality and economic growth
Table 2. Stationarity of the variables
Table 3. ARDL bounds test for cointegration results without structural breaks
Table 4. Long-run and short-run estimation results of the model without structural breaks
Figure 3. The plot of the cumulative sum of the recursive residuals.
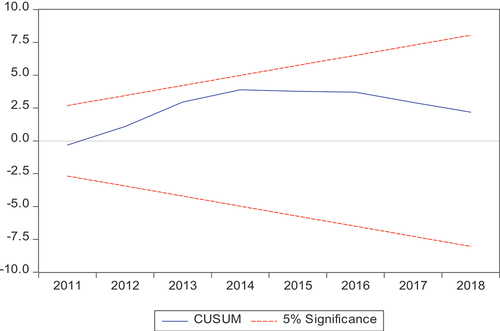
Figure 4. The plot of the cumulative sum of squares of recursive residuals.
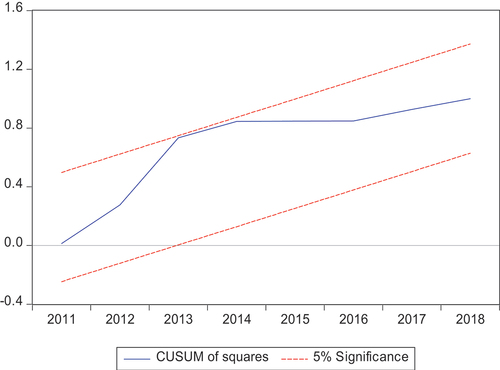
Table 5. Long-run and short-run results with structural breaks
Figure 5. The plot of the cumulative sum of the recursive residuals with structural breaks.
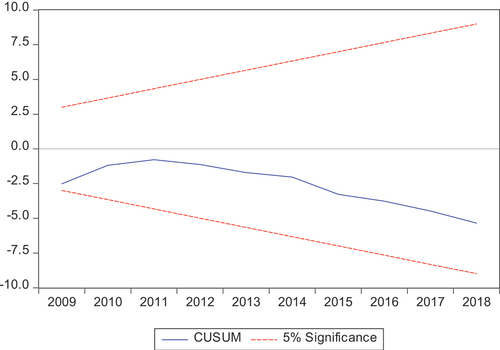
Figure 6. The Plot of the cumulative sum of squares of recursive residuals with structural breaks.
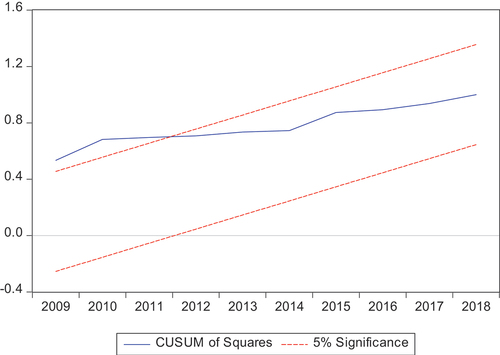
Table A1. Descriptive statistics of economic growth, income inequality, human capital, population growth physical capital, and government expenditure, 1989–2018