Figures & data
Figure 1. Number of strikes in South Africa from 1981 to 2018.
Source: International Labour Organization (ILO) Database.
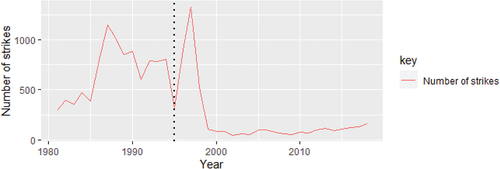
Figure 2. Descriptive statistics.
Source: Authors.
Figure 3. Structural analysis of strikes shock to non-agriculture employment, GVA, and inflation.
Notes: Impulse responses were generated using the Ibvar package in R. The dashed lines represent the 90% and 95% confidence bands of the Bayesian credible sets obtained through Gibbs sampling with 1000 draws of ∑. Source: Authors.
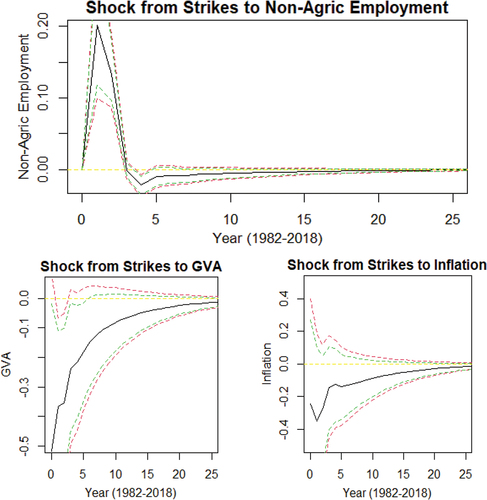
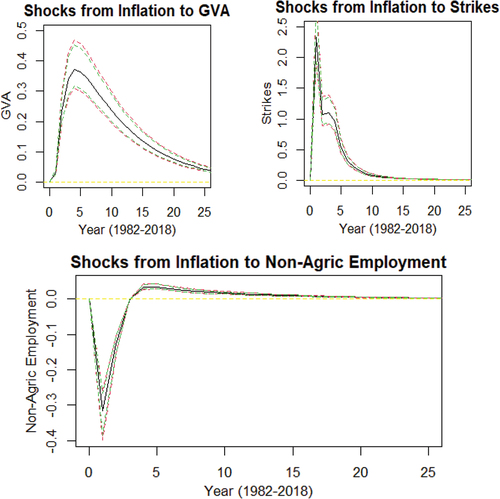
Figure 4. Inflation shock to GVA, strikes, and non-agriculture employment.
Notes: Impulse responses were generated using the Ibvar package in R. The dashed lines represent the 90% and 95% confidence bands of the Bayesian credible sets obtained through Gibbs sampling with 1000 draws of ∑. Source: Authors