Figures & data
Figure 1. Trade union coverage (No. of unionized work/total no. of work %).
Source: Author`s construction based on GLFS 2015.
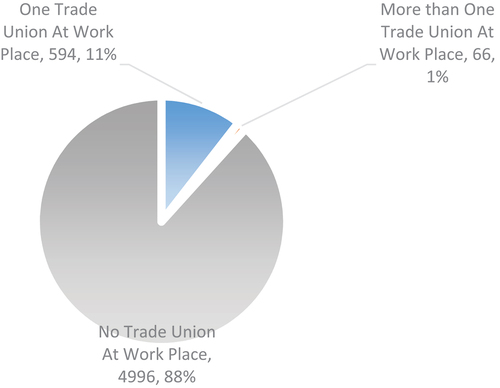
Figure 2. Registration status of trade unions present at workplace.
Source: Author`s construction based on GLFS 2015 Data.
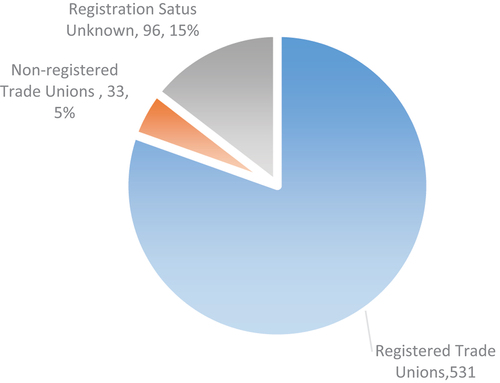
Table 1. Regional trend of union coverage from 1991/1992 to 2015
Table 2. Sources of data extracted for the study
Table 3. Summary statistics of all variables
Table 4. Heckman`s two-step estimates of the union wage premium from 2005/2006 to 2015 (Observed wage equation)
Table 5. Quantile regression estimates of the union wage premium (2012/2013 and 2015)
Table A1. Heckman`s two-step estimates of the union wage premium from 2005/2006 to 2015 (Selection equation)
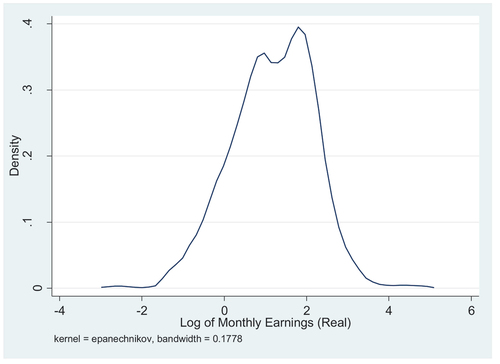
Figure A1. Kernel`s earnings distribution (Based on GLSS 6–2012/2013).
Source: Author`s Construction Based on Data Extracted from GLSS 6.
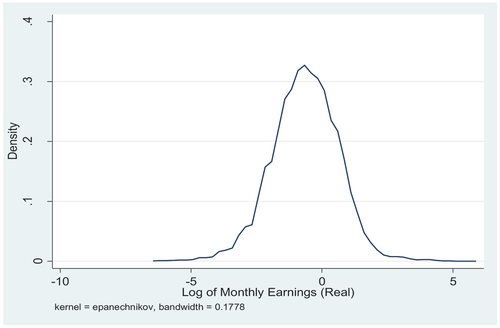
Figure A2. Kernel`s earnings distribution (Based on 2015 GLFS).
Source: Author`s Construction Based on Data Extracted from GLFS, 2015.