Figures & data
Figure 1. Cumulative returns of momentum-sorted naïve and optimised portfolios over the period January 2002 until October 2021.
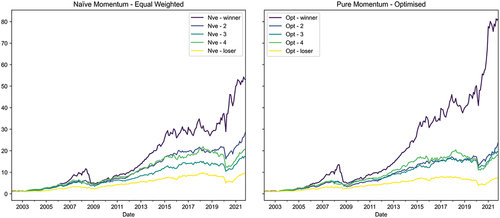
Table 1. Monthly average excess return and Sharpe ratios of naive and optimised momentum-sorted quintile portfolios from January 2002 to October 2021. Momentum is proxied by cumulative returns over the previous 252 trading days, skipping the most recent 21 days, and the risk-free rate proxied by 91-day SA government T-bill. Average returns are expressed monthly in excess of risk-free proxy with “***”, “**” and “*” indicating statistical significance at the 1%, 5% and 10% levels
Figure 2. Cumulative returns of value-sorted naïve and optimised portfolios from January 2002 to October 2021.
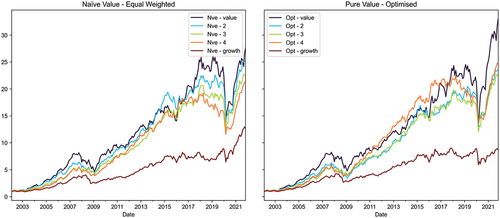
Table 2. Monthly average excess return and Sharpe ratios of naive and optimised value-sorted quintile portfolios from January 2002 to October 2021. Value is proxied by earnings yield adjusted for look-ahead bias by lagging accounting data by 63 days. Average returns expressed monthly in excess of risk-free proxy with “***”, “**” and “*” indicating statistical significance at the 1%, 5% and 10% levels
Figure 3. Cumulative returns of size-sorted naïve and optimised portfolios from January 2002 to October 2021.
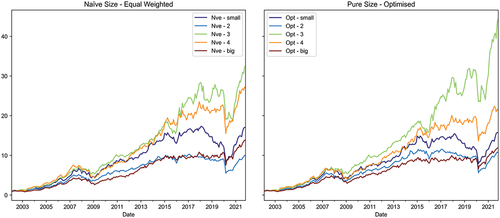
Table 3. Monthly average excess return and Sharpe ratios of naive and optimised size-sorted quintile portfolios from January 2002 to October 2021. Value is proxied by earnings yield adjusted for look-ahead bias by lagging accounting data by 63 days. Average returns expressed monthly in excess of risk-free proxy with “***”, “**” and “*” indicating statistical significance at the 1%, 5% and 10% levels
Figure 4. Cumulative performance of momentum, value, and size naïve and optimised factor premiums over the period January 2002 until October 2021.
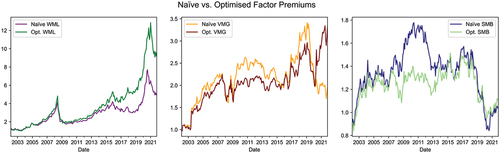
Table 4. Average monthly excess returns (factor premiums) and Sharpe ratios across naive and optimised across momentum, value, and style extreme quintiles. “***”, “**” and “*” indicate statistical significance at the 1%, 5% and 10% levels
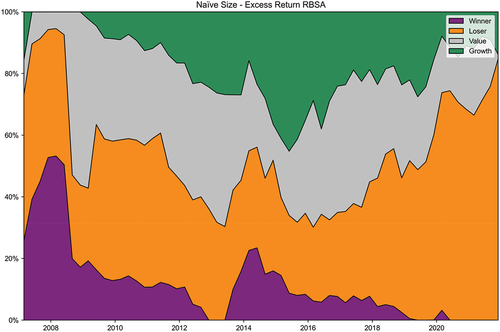
Figure 5a. Returns-based style analysis per Sharpe (Citation1991) on naive long-only momentum (Q1) using naïve value, growth, and small- and large-cap quintile returns.
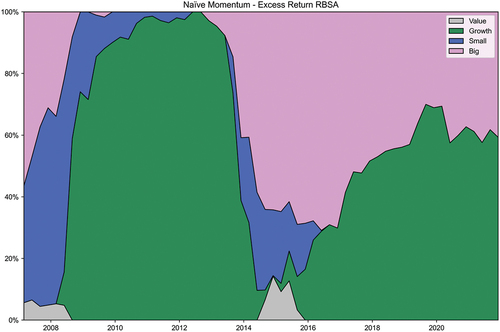
Figure 5b. Returns-based style analysis per Sharpe (Citation1991) on optimised long-only momentum (Q1) using optimised value, growth, and small- and large-cap quintile returns.
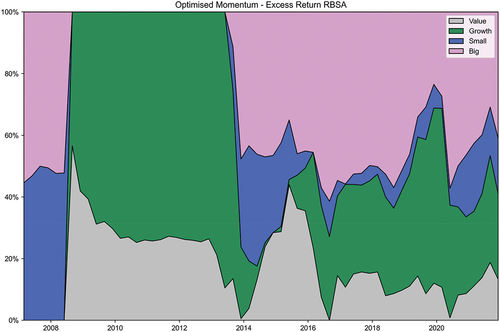
Figure 6. Rolling 60-month correlations on naive and optimised momentum.
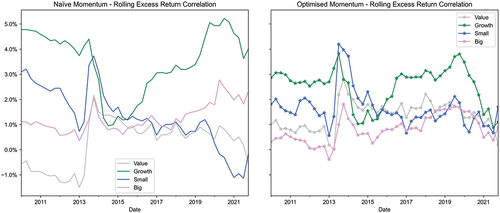
Figure 7a. Returns-based style analysis per Sharpe (Citation1991) on naïve long-only value (Q1) against naive winner, loser, and small- and large-cap quintile returns.
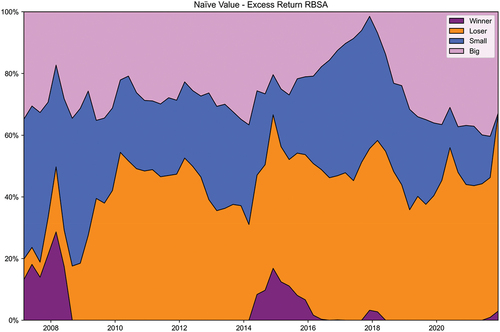
Figure 7b. Returns-based style analysis per Sharpe (Citation1991) on optimised long-only value (Q1) against optimised winner, loser, and small- and large-cap quintile returns.
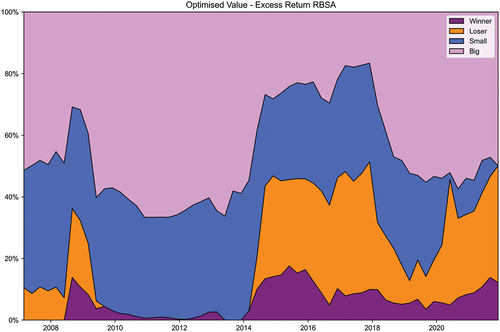
Figure 8. Rolling 60-month correlations on naïve and optimised value.
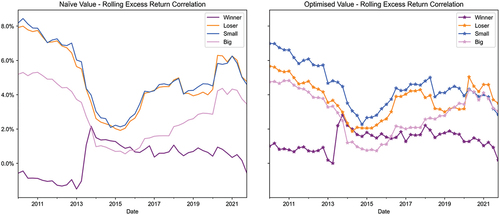
Figure 9b. Returns-based style analysis per Sharpe (Citation1991) on optimised long-only size (Q1) against optimised winner, loser, and small- and large-cap quintile returns.
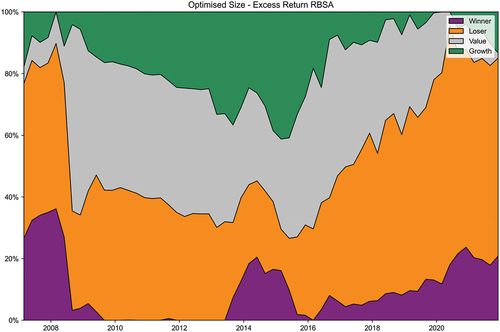
Figure 10. Rolling 60-month correlations on naïve and optimised small-cap quintiles.
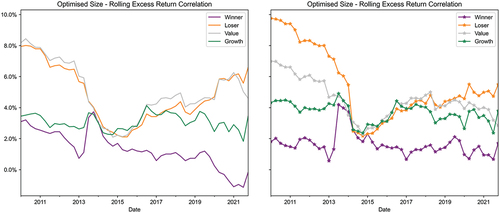
Figure 9a. Returns-based style analysis per Sharpe (Citation1991) on naïve long-only size (Q1) against naive winner, loser, value, and growth quintile returns.