
Figures & data
Figure 1. The overview of research framework.
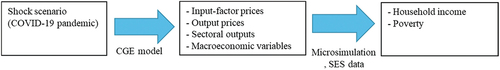
Table 1. Assumptions regarding the attack rate and the case-fatality rate
Table 2. Assumptions regarding the change in labor supply
Table 3. Percentage change in costs of production by sector and country
Table 4. GDP share from sectors that were directly affected by COVID-19
Table 5. Assumptions regarding the change in consumption demand
Table 6. Assumptions regarding the change (unexpected) in countries’ risk premiums
Table 7. Income and expenditure of international tourism by country
Table 8. Expenditure on domestic tourism to final consumption by country
Table 9. International tourism income and international tourism expenditure by country (Unit: Million US$)
Table 10. Assumptions regarding the changes in inbound and domestic tourism demand
Table 11. Policy responses through the end of second wave of COVID-19 infections in Thailand
Table 12. Macroeconomic impact of the COVID-19 pandemic at the end of the second wave in Thailand (Unit: percent change)
Table 13. Sectoral impact of the COVID-19 pandemic at the end of the second wave in Thailand (the 15 largest output losses)
Figure 3. Impact of the COVID-19 pandemic on poverty in Thailand.
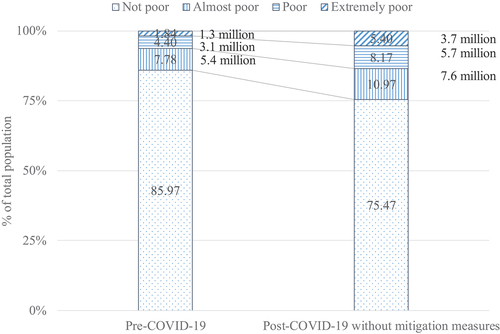
Figure 4. Percent change in the number of poor people classified by characteristics of the household head.
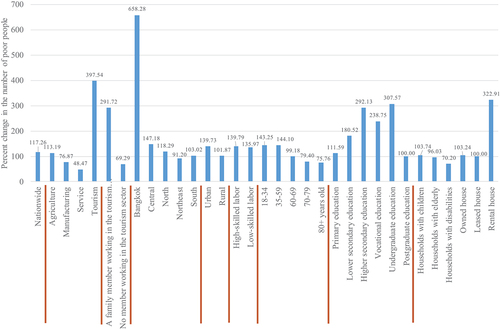
Table 14. Macroeconomic impact of COVID-19 relief and tourism stimulus measures in Thailand (Unit: Percent change, unless otherwise indicated)
Figure 5. Impact of the government’s relief measures on poverty in Thailand.
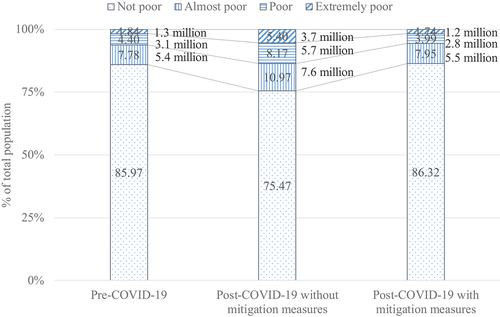
Table 15. Benefit recipients from COVID-19 relief measures
Figure 6. Percent of poor people receiving adequate benefits by characteristics of the household head.
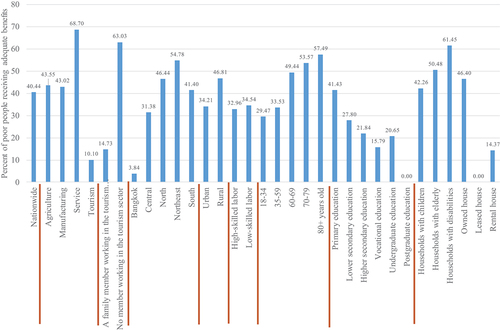
Table 16. Benefits from COVID-19 relief measures by income decile