
Figures & data
Figure 1. Conceptual framework on inter-sectoral linkages.
Figure 2. Sectoral direct and indirect impacts.
Table 1. Variables description
Table 3. Sub-sectoral total multiplier effects
Table 2. Production and consumption linkages
Table 4. Sub-sectoral linkages and multipliers effects from SAM 2009/10 demand shock
Table 5. VECM long run and speed of adjustment results
Table 6. Multipliers under constrained agricultural sector supply
Table 7. Descriptive results
Table 8. Time series unit root tests
Table 9. Aggregate short-run inter-sectoral linkages
Table 10. VECM model diagnostic test
Figure 3. CUSUM measure of model stability.
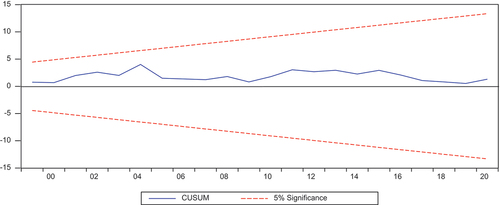
Figure 4. Graph of the Cumulative Sum of Squares (Cusumq).
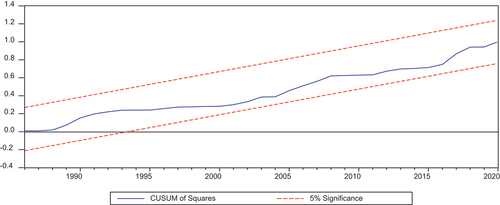
Table 11. Sectoral production linkages in Uganda
Table A1. SAM 2016/17 inter-sectoral linkages and exogenous demand shock
Table A2. Correlation matrix
Table A3. Johansen/Unrestricted cointegration rank test
Table A4. VEC granger causality/block exogeneity wald tests
Table A5. Forecast Error Variance Decomposition (FEVD)
Table A6. VECM-Short run output