
Figures & data
Figure 1. 10 top remittance receiving countries in Sub-Saharan Africa.
Source: World Bank (Citation2022)
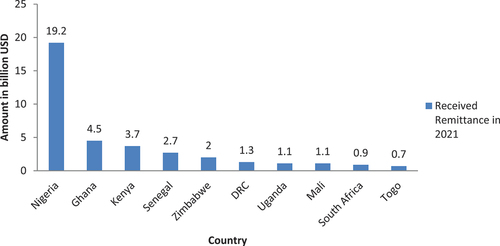
Table 1. Summary statistic of Variables
Figure 2. Trend graph of Gross Domestic Product and received remittances as % of GDP.
Source: Author’s construct, 2022.
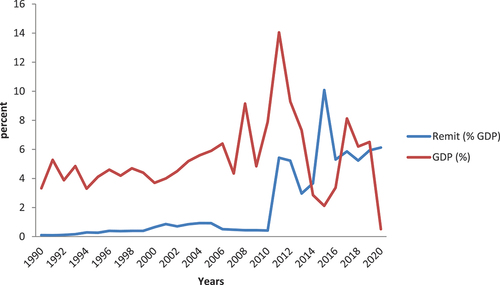
Table 2. Unit root test result (ADF)
Table 3. Bound test results
Table 4. Long-run effect of Remittance on GDP
Table 5. Short Run Remittance impact on GDP growth
Table 6. Results of Residual and Stability Tests
Figure A1. CUSUM and CUSUMSQ test results for the model.
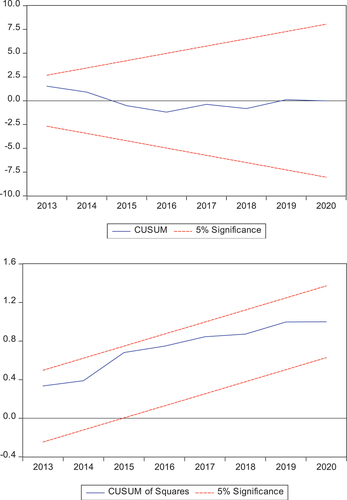
Table A1. Variables and their Measurements