
Figures & data
Table 1. Sharpe ratio of each portfolio and each transaction cost
Figure 1. Total volatility spillover. The red and green dotted lines denote the increase and decrease of the total volatility spillover.
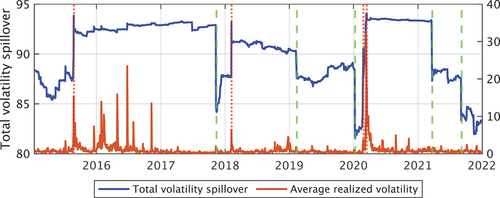
Figure 2. The time-varying portfolio weight of the food and steel sectors. The blue line is reallocated every day, and the red line is reallocated depending on the increase or decrease of the volatility spillover.
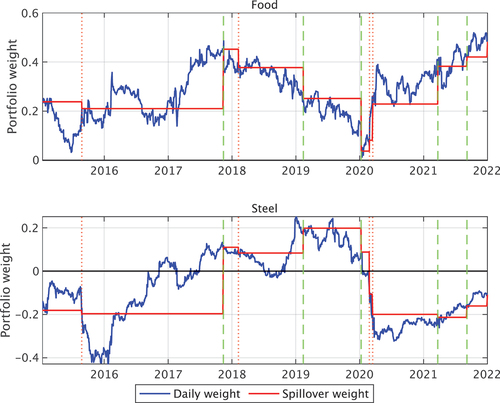
Figure 3. Cumulative returns net of three types of transaction costs with an initial value of ¥ 10,000. The spillover weight portfolio is based on the increase and decrease in the volatility spillover.
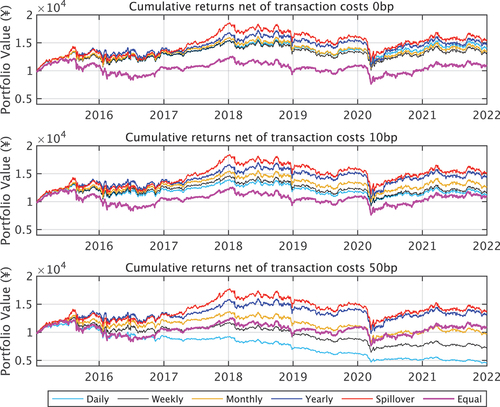
Table 2. Sharpe ratio of each portfolio and each transaction cost
Figure 4. Cumulative returns net of three types of transaction costs with an initial value of ¥ 10,000. The spillover weight portfolio is based on the increase in the volatility spillover.
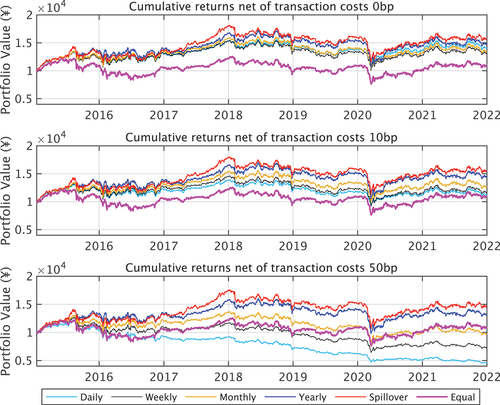
Figure 5. Cumulative returns net of three types of transaction costs with an initial value of ¥ 10,000. The spillover weight portfolio is based on the decrease in the volatility spillover.
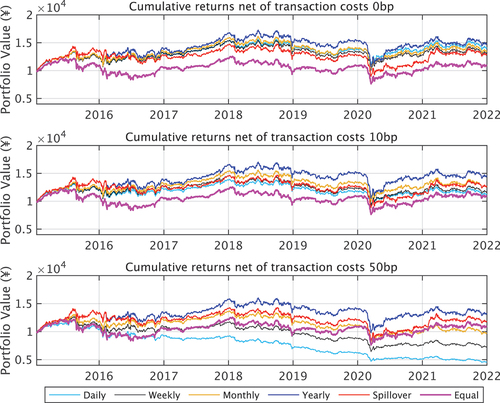
Table 3. Sharpe ratio of two spillover weight portfolios depending on the increase and the decrease in the volatility spillover
Figure 6. Robustness checks of time-varying spillover. The red line shows the baseline spillover whose order, window size, and forecast error horizon are ,
, and
, respectively. The light blue area shows from the minimum value to maximum value, and the dark blue area denotes the 25% and 75% quantiles.
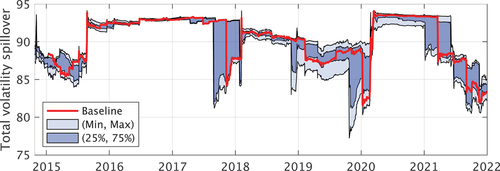
Table 4. Sharpe ratio of each portfolio and each transaction cost
Table 5. Sharpe ratio of minimum variance and mean-variance portfolios without short position