
Figures & data
Figure 1. Gold price (Unit: VND million per troy ounce).
Source: Doji Group.
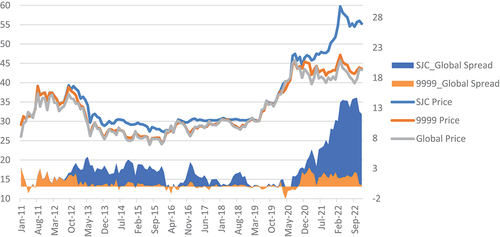
Figure 2. Bid–ask spread (Unit: VND million per troy ounce).
Source: Doji Group.

Figure 3. Gold price and CPI.
Source: Doji Group, General Statistics Office (GSO).
Note: To compare between gold prices and CPI, all three variables are calculated from the base of 100 as in January of 2011.
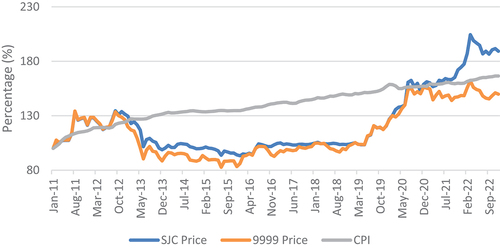
Table 1. Unit root test
Table 3. Structural break
Table 5. Estimation of NARDL model (Local gold prices – Global gold price – CPI)
Table 6. Wald test for short- and long-run symmetry (with quarterly data)
Table 2. Wald test for short- and long-run symmetry
Table 7. Estimation of NARDL model (Local gold prices – Global gold price—CPI) (with quarterly data)
Table 4. Estimation of NARDL model (Local gold prices and CPI)
Data availability statement
The data that support the findings of this study are openly available in figshare at https://doi.org/10.6084/m9.figshare.22720519.v1