
Figures & data
Table 1. Descriptive statistics
Figure 1. Evolution of return and volatility.
Table 2. Static connectedness and spillover (return)
Table 3. Static connectedness and spillover (volatility)
Figure 2. Total connectedness index.
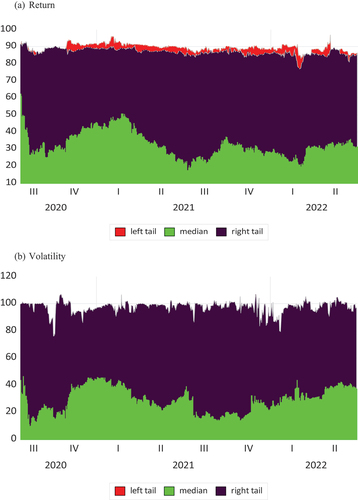
Figure 3. Net directional spillover.
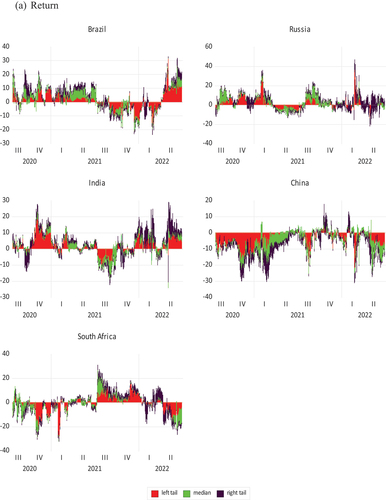
Figure 3. (Continued).
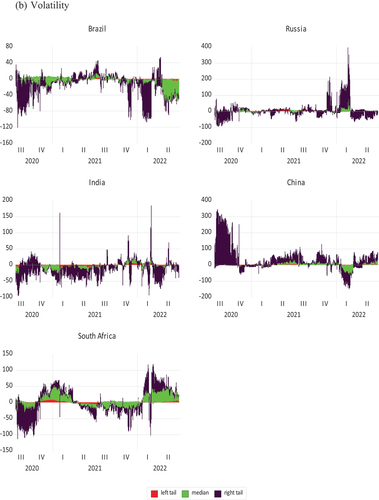
Table A1. Review of previous studies on BRICS equity market spillovers
Table A2. Robustness test for the GARCH model
Table A3. Zivot-Andrew structural break unit root test result