
Figures & data
Figure 1. Simple Moving Average
Figure 2. Momentum chart
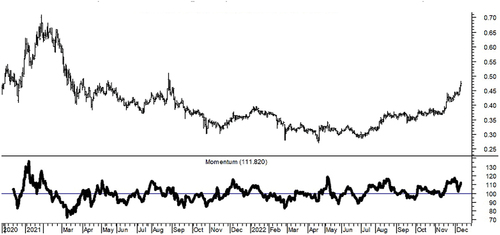
Figure 4. RSI chart
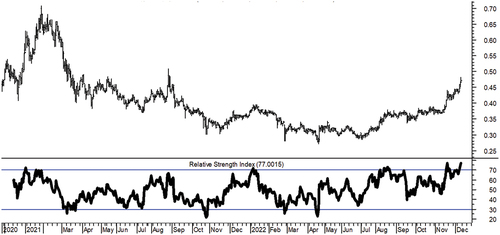
Figure 5. ANN Structure
Figure 6. Artificial neural network Program.

Figure 3. MACD chart
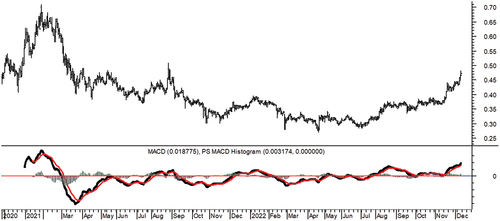
Figure 7. Artificial neural network Parameters.
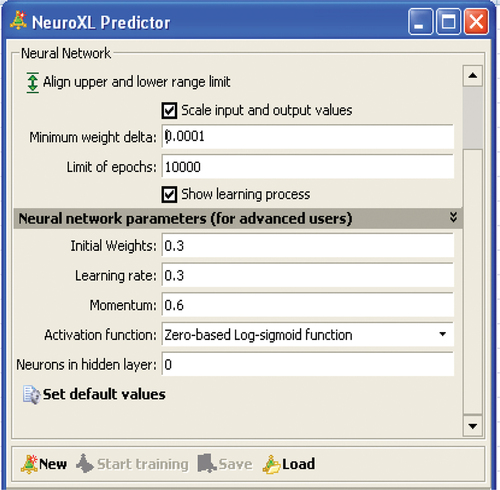
Table 1. Study variables
Table 2. Components of the study sample
Figure 8. Distribution of the hold rate for USD/AED.
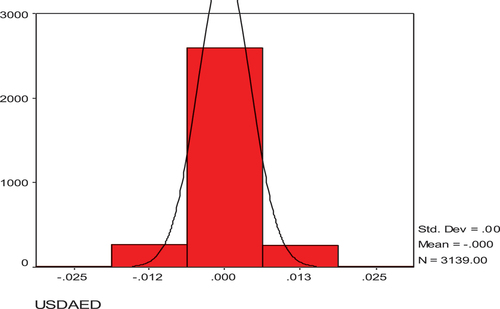
Figure 9. Distribution of the hold rate for USD/ARS.
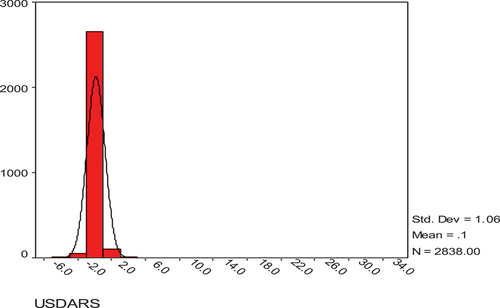
Figure 10. Distribution of the hold rate for USD/BRL.
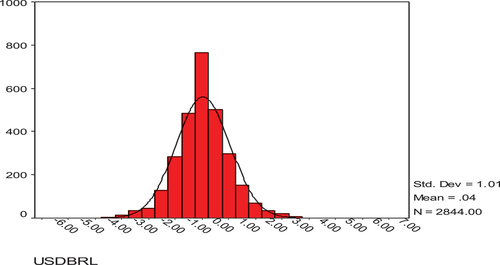
Figure 11. Distribution of the hold rate for USD/CLP.
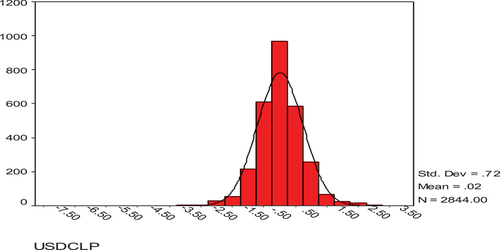
Figure 12. Distribution of the hold rate for USD/CNY.
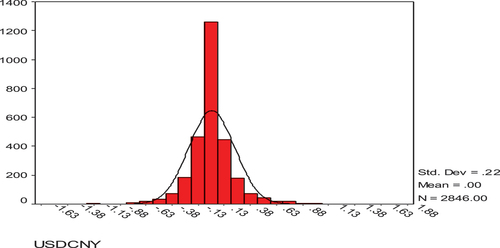
Figure 13. Distribution of the hold rate for USD/EGP.
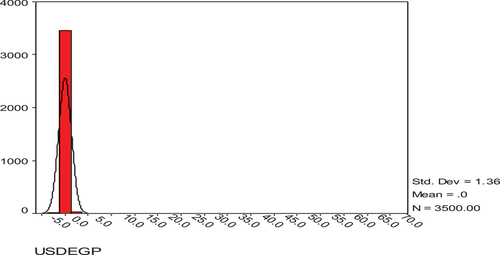
Figure 14. Distribution of the hold rate for USD/ETB.
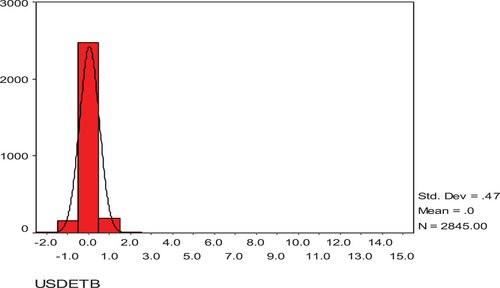
Figure 15. Distribution of the hold rate for USD/INR.

Figure 16. Distribution of the hold rate for USD/IQD.
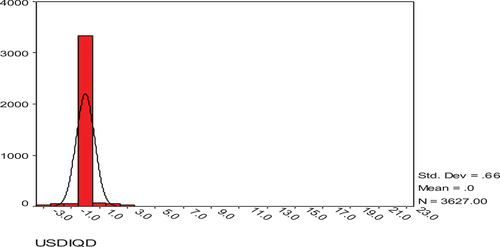
Figure 17. Distribution of the hold rate for USD/JOD.
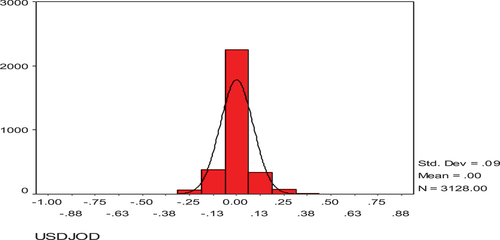
Figure 18. Distribution of the hold rate for USD/KES.
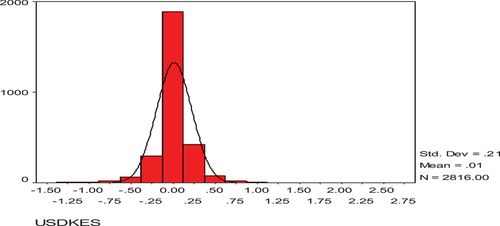
Figure 19. Distribution of the hold rate for USD/MAD.
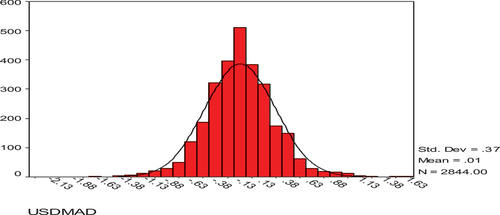
Figure 20. Distribution of the hold rate for USD/NGN.
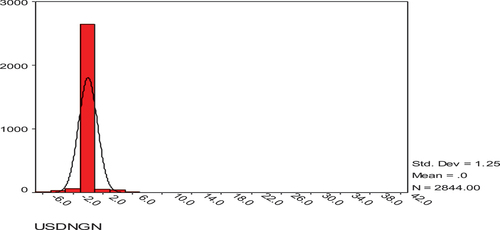
Figure 21. Distribution of the hold rate for USD/PEN.
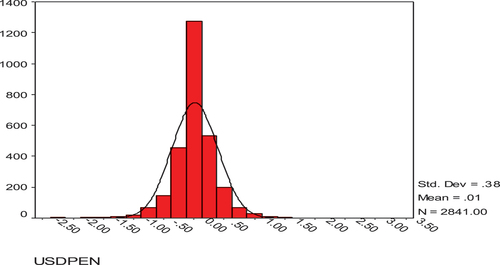
Figure 22. Distribution of the hold rate for USD/PKR.
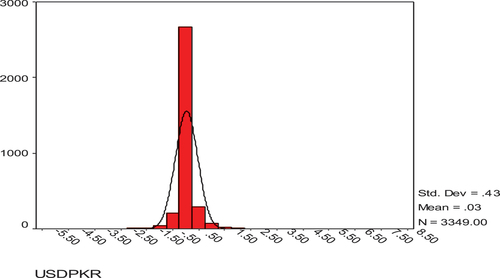
Figure 23. Distribution of the hold rate for USD/PLN.
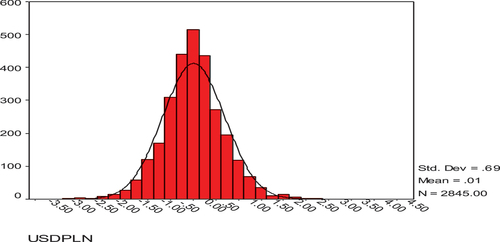
Figure 24. Distribution of the hold rate for USD/RUB.
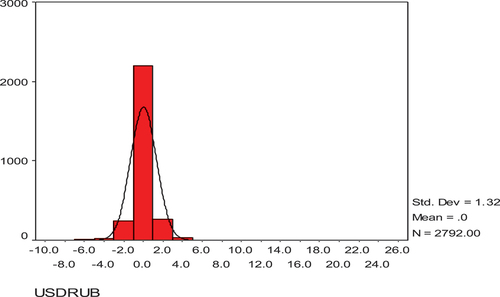
Figure 25. Distribution of the hold rate for USD/SDG.
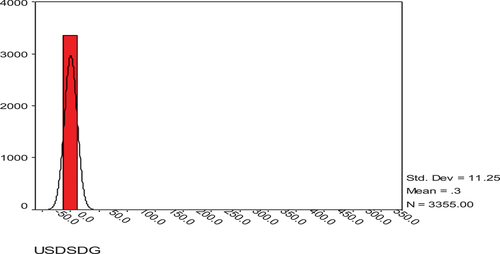
Figure 26. Distribution of the hold rate for USD/TND.
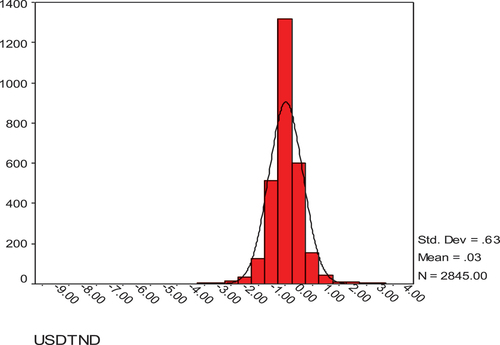
Figure 27. Distribution of the hold rate for USD/TRY.
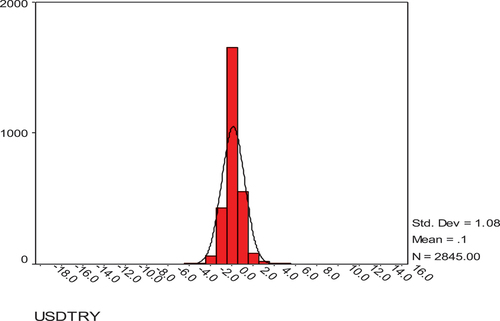
Figure 28. Distribution of the hold rate for USD/TWD.
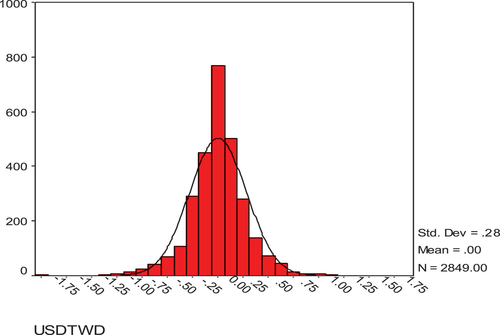
Figure 29. Distribution of the hold rate for USD/VND.
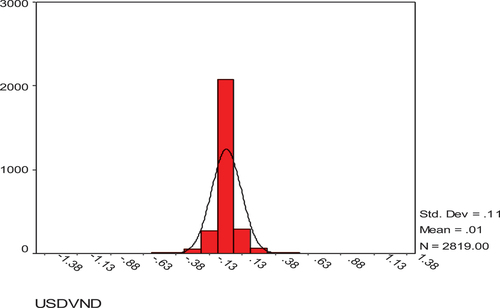
Figure 30. Distribution of the hold rate for USD/XAF.
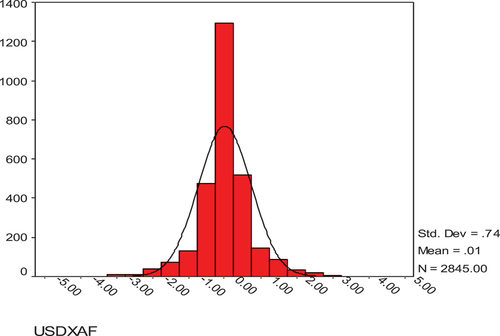
Figure 31. Distribution of the hold rate for USD/ZAR.
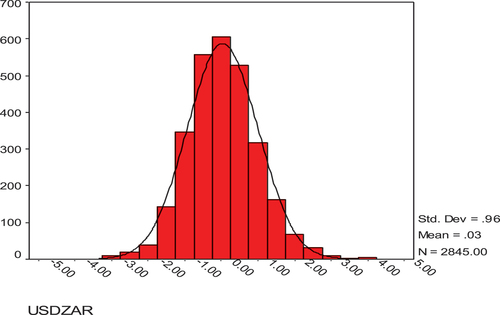
Table 3. Cross-sectional analysis between actual values of exchange rates and four indicators of technical analysis
Table 4. Enter technical indicators for the study model
Table 5. Significant of model layers
Table 6. Cross-sectional analysis between expected and actual values of exchange rates
Table 7. Wilcoxon signed ranks test outputs
Table 8. Kruskal-Wallis test outputs
