Figures & data
Figure 1. Networks from 2006 to 2020.Footnote4
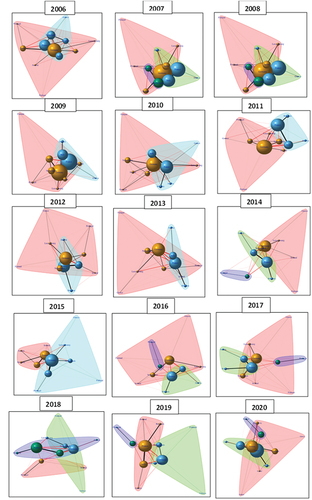
Figure 2. Modularity.
Figure 3. Degree total.
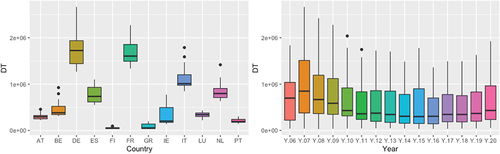
Figure 4. Degree in.
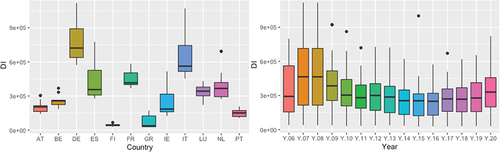
Figure 5. Degree out.
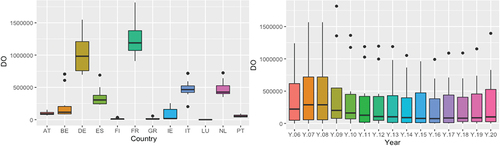
Figure 6. Betweenness.
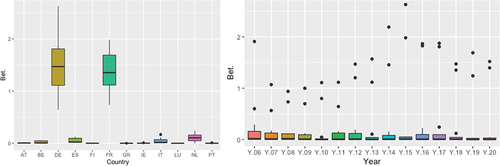
Figure 7. Authority.
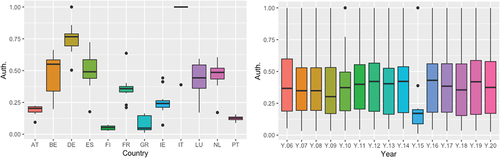
Table 1. Bank variables
Figure 8. Correlations.
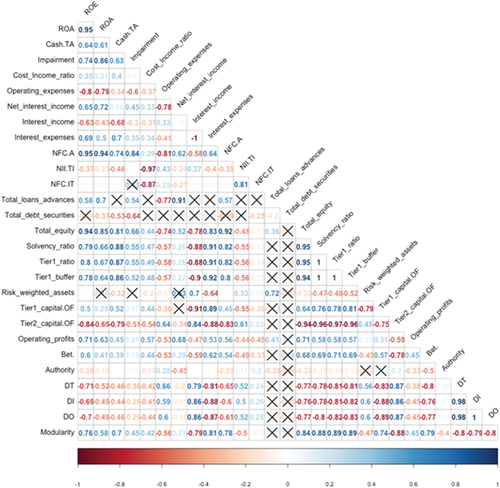
Figure 9. Regulatory ratios.
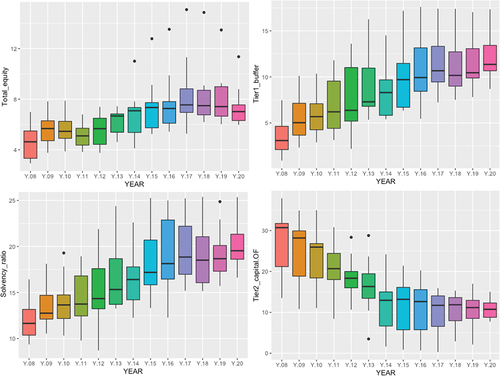
Figure 10. Cash over total assets.
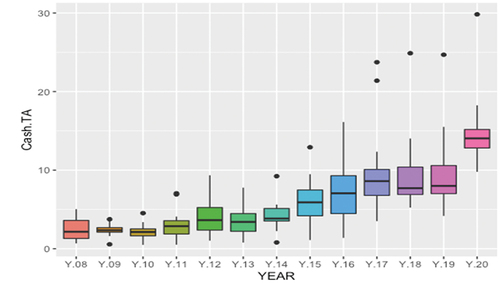
Figure 11. Risk weighted assets per year.
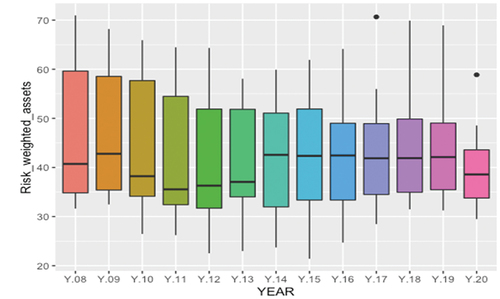
Table 2. Economic variables
Figure 12. Risk weighted assets per country.
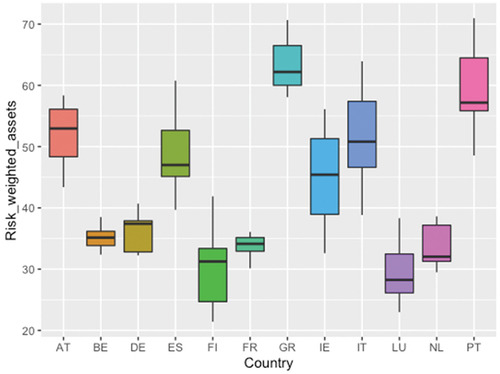
Figure 13. Regression tree (bank push variables).
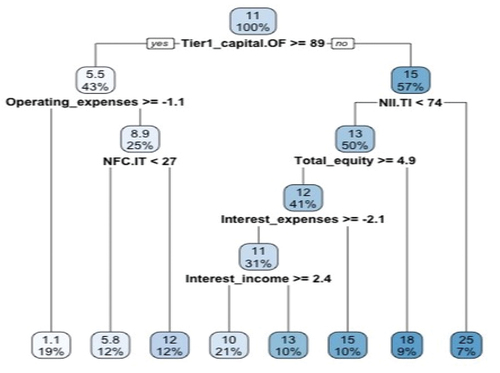
Figure 14. Alluvial (bank push variables).
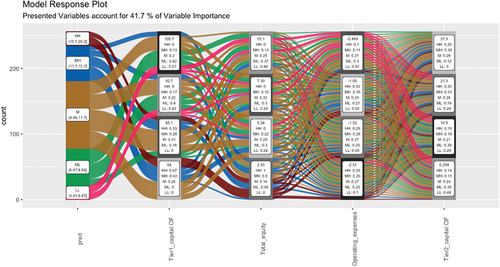
Figure 15. Partial derivatives (bank push variables).
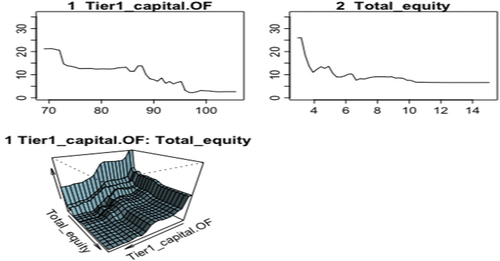
Figure 16. Regression tree (bank pull variables).
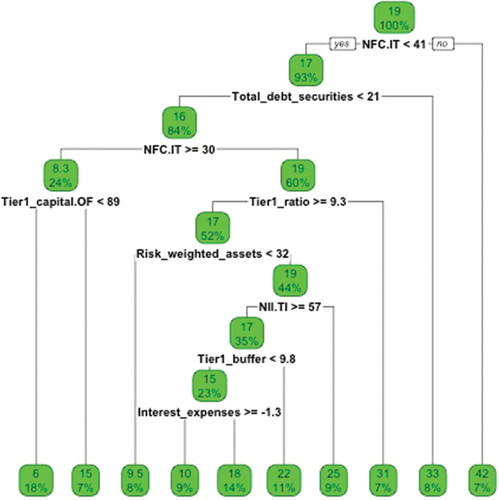
Figure 17. Alluvial (bank pull variables).
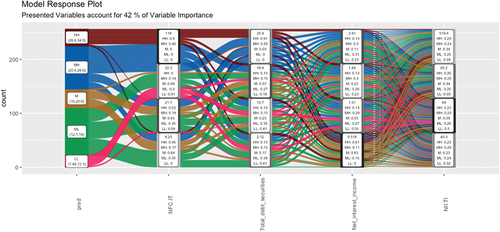
Figure 18. Partial derivatives (bank pull variables).
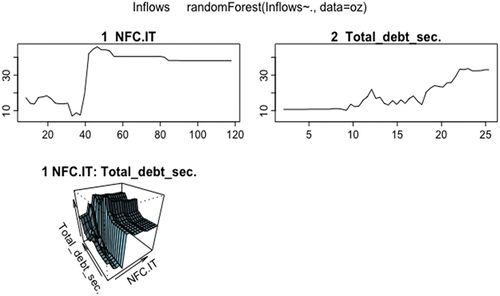
Figure 19. Regression tree (economic push variables).
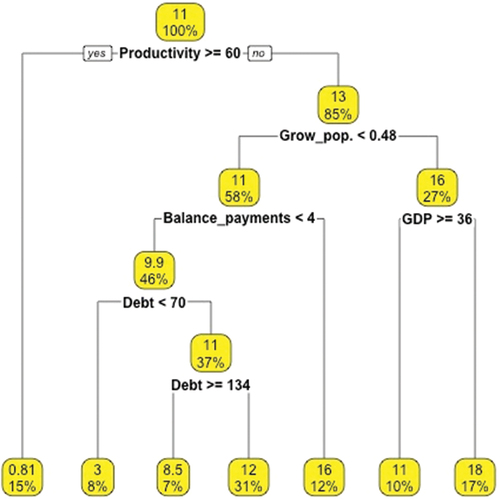
Figure 20. Alluvial (economic push variables).
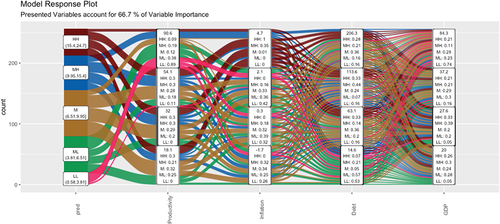
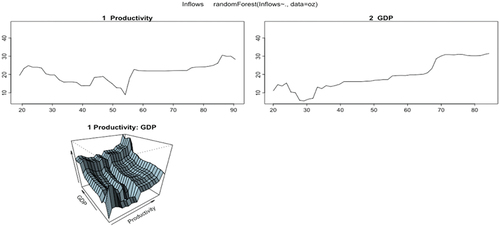
Figure 21. Partial derivatives (economic push variables).
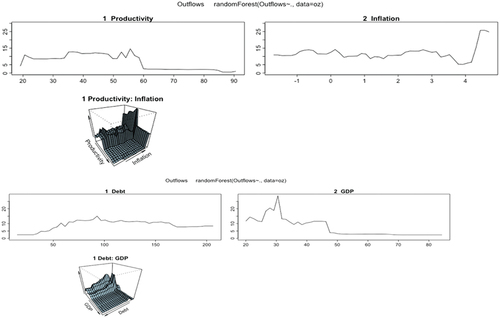
Figure 22. Regression tree (economic push variables).
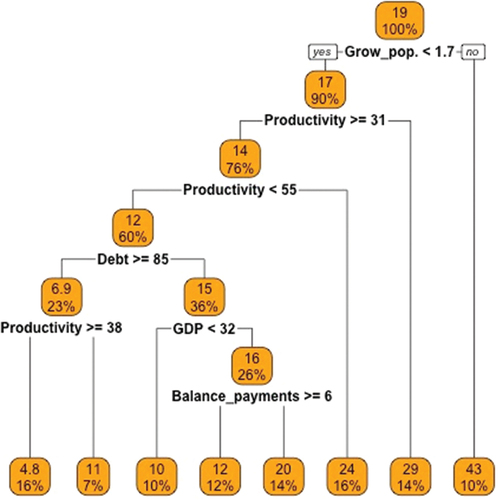
Figure 23. Alluvial (economic pull variables).
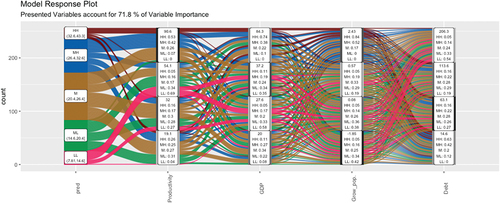
Figure 24. Partial derivatives (economic pull variables).