
Figures & data
Table 1. Descriptive statistics of the returns and drivers of return volatility
Figure 1. Time series of conditional volatilities.
These graphs show conditional volatilities of all 10 stock markets under consideration in this paper.
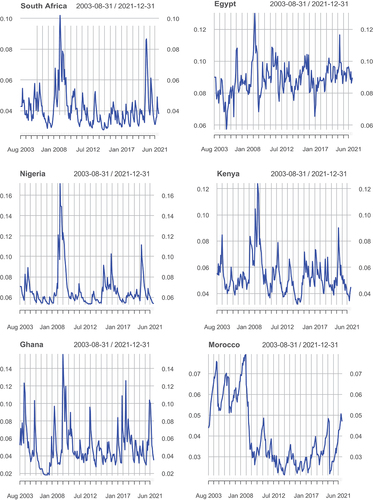
Figure 1. (Continued).
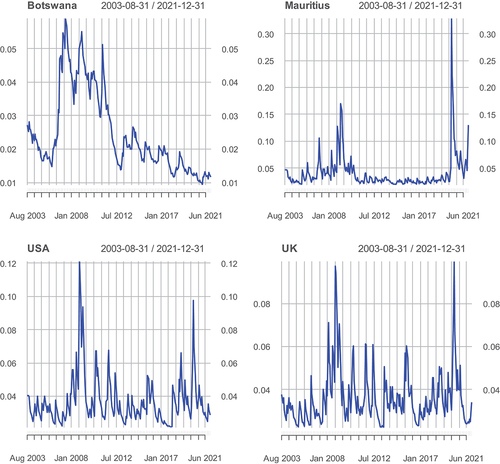
Table 2. Estimates of GARCH (1,1) models
Table 3. Unit root test results
Table 4. Correlation between predictive variables
Table 5. LSDVC estimates: drivers of African stock markets return volatility
Table 6. Drivers of African stock markets return volatility before, during and after crisis (GFC and Covid-19)
Table 7. Drivers of stock return volatility within African regions