
Figures & data
Table 1. Parameter estimation results on the market data of SPX options on June 2022 with (standard) options maturing on 19 August , 16 September 2022, 21 October 2022, 18 November 2022, 16 December 2022, 20 January 2023, 17 February 2023, 17 March 2023, 21 April 2023, 19 May 2023, 16 June 2023, 21 July 2023, 15 September 2023, 15 December 2023, 21 June 2024, 20 December 2024, 19 December 2025, and 18 December 2026. The S&P 500 index level was
Table 2. Parameter estimation results on the market data of SPX options on July 2022 with (standard) options maturing on 19 August , 16 September 2022, 21 October 2022, 18 November 2022, 16 December 2022, 20 January 2023, 17 February 2023, 17 March 2023, 21 April 2023, 19 May 2023, 16 June 2023, 21 July 2023, 15 September 2023, 15 December 2023, 21 June 2024, 20 December 2024, 19 December 2025, and 18 December 2026. The S&P 500 index level was
Table 3. Parameter estimation results on the market data of SPX options on July 2022 with (standard) options maturing on 19 August , 16 September 2022, 21 October 2022, 18 November 2022, 16 December 2022, 20 January 2023, 17 February 2023, 17 March 2023, 21 April 2023, 19 May 2023, 16 June 2023, 21 July 2023, 15 September 2023, 15 December 2023, 21 June 2024, 20 December 2024, 19 December 2025, and 18 December 2026. The S&P 500 index level was
Table 4. Parameter estimation results on the market data of SPX options on July 2022 with (standard) options maturing on 19 August , 16 September 2022, 21 October 2022, 18 November 2022, 16 December 2022, 20 January 2023, 17 February 2023, 17 March 2023, 21 April 2023, 19 May 2023, 16 June 2023, 21 July 2023, 15 September 2023, 15 December 2023, 21 June 2024, 20 December 2024, 19 December 2025, and 18 December 2026. The S&P 500 index level was
Figure 1. Comparison of estimated option-implied risk-free interest rates obtained via the three estimation techniques (OLS, TS, and RM) across different maturities with treasury yields.
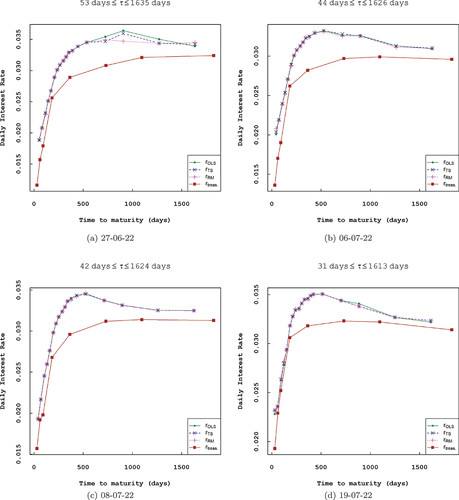
Figure 2. Estimated option-implied dividend yields obtained via the three estimation techniques (OLS, TS, and RM) across different maturities.
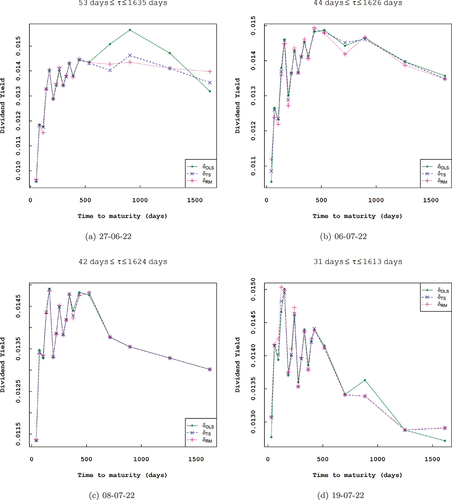
Figure 3. Comparison of estimated annualized option-implied dividend yields obtained via the three estimation techniques (OLS, TS, and RM) across different maturities with historical S&P 500 index yield.
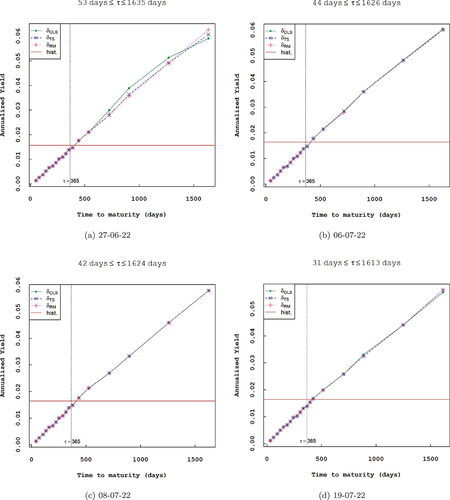
Table 5. The US. Daily treasury yield curve rates (%) between 27 June 2022 and 19 July 2022