
Figures & data
Figure 1. Growth, broad money and credit to the private sector trends, 1970–2020.
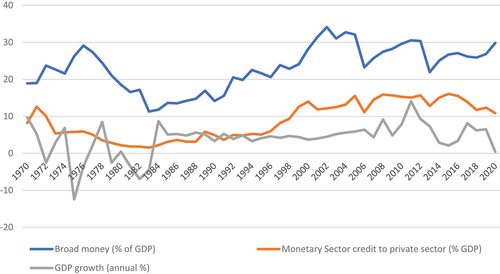
Table 1. Bayesian model averaging results
Table 2. Posterior means of the best five models
Figure 2. Cumulative model Probabilities.
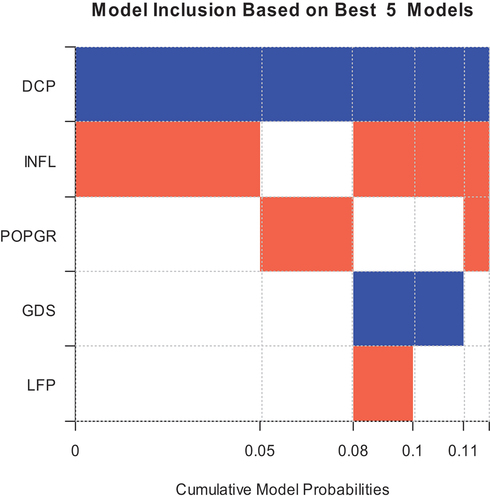
Table A1. Model variables
Table A2. Correlation matrix of variables
Table A3. Descriptive statistics
Table A4. PMP and MCMC of the best five models
Figure A1. Posterior model size distribution and model probabilities produced from the BMS package with “uniform” model priors.
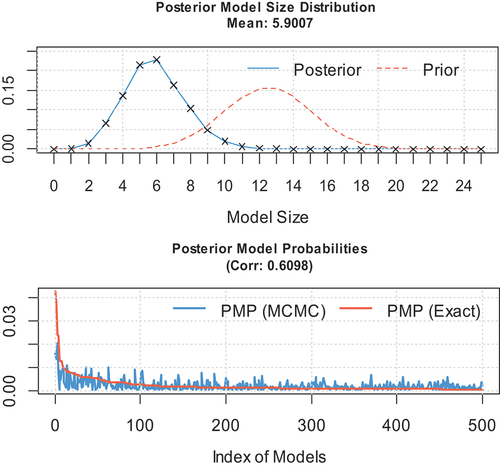
Table A5. Bayesian model averaging results with “flexible” g-prior
Table A6. Bayesian model averaging results with “hyper” g-prior
Table A7. Bayesian model averaging results with “EBL” g-prior