
Figures & data
Table 1. Descriptive statistics for annual data for 2017–2021
Table 2. Socio-economic indicators of the regions of Kazakhstan in 2021
Figure 4. The share of the population with incomes used for consumption below the subsistence level, %.
Source: KazStat (Citation2023)
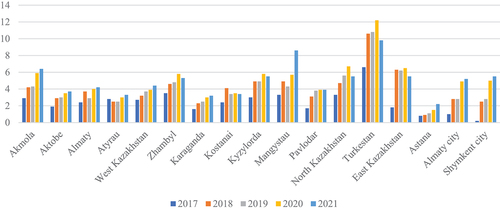
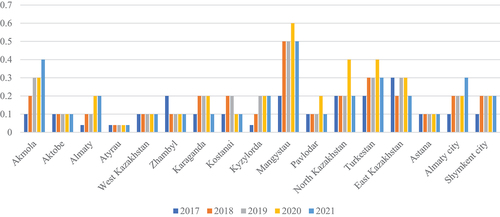
Table 3. Probit-model, dependent variable unrest