
Figures & data
Table 1. Comparison of stock markets in Vietnam as of 31 October 2022
Table 2. Descriptive statistics for market return (Rm), CSSD, and CSAD series (HoSE, HNX, and UpCOM) for the whole period (from 1 January 2018 to 31 October 2022)
Figure 1. Relationship between market return and CSSD in different periods.
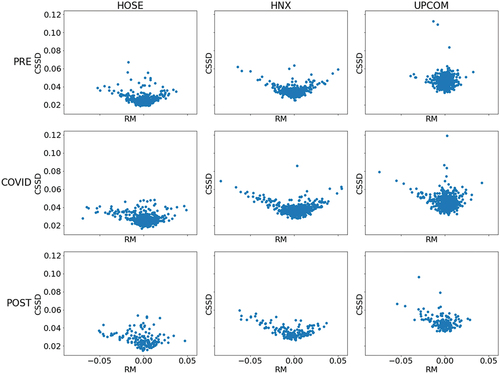
Table 3. Estimates of herd behavior during market extreme movements with CSSD
Figure 2. Relationship between market return and CSAD in different periods.
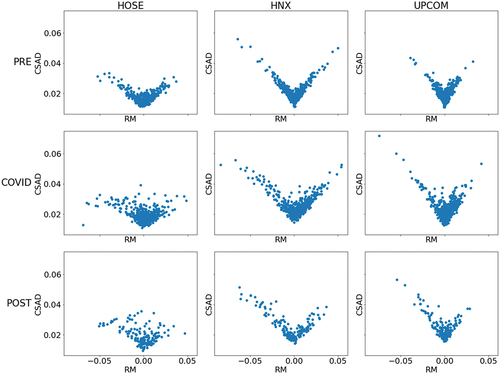
Table 4. Estimates of herd behavior by non-linearity test between total CSAD and market returns
Figure 3. Relationship between market return and fundamental CSAD in different periods.
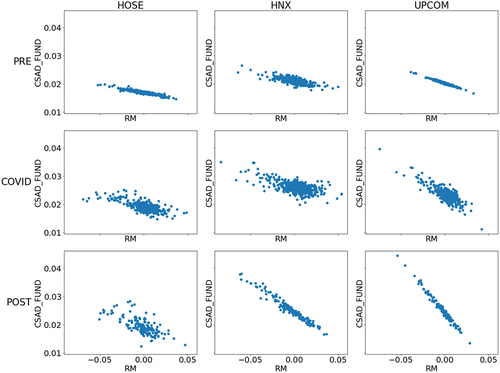
Table 5. Estimates of herd behavior by non-linearity test between decomposed components of CSAD and market returns
Figure 4. Relationship between market return and non-fundamental CSAD in different periods.
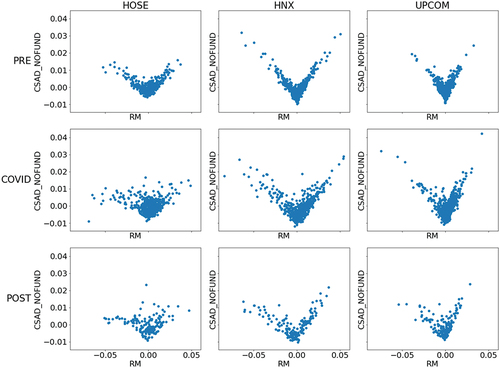
Table 6. Estimates of herd behavior on days of high volatility by non-linearity test between total CSAD and market returns
Table 7. Estimates of herd behavior on days of high volatility by non-linearity test between fundamental CSAD and market returns
Table 8. Estimates of herd behavior on days of high volatility by non-linearity test between non-fundamental CSAD and market returns
Table 9. Estimates of the impact of pandemic uncertainty and government response strictness on herd behavior