
Figures & data
Table 1. Environmental protection tax bracket of petroleum
Table 3. Household budget shares of fuel spending by product (percent of total household expenditure for living)
Table 4. Direct expenditure effects of petroleum price increases by household income quintile, rural-urban
Figure 1. Price changes of Commodities in other sectors due to a 5 percent increase in petroleum prices (in percent). Only sectors with an average expenditure effect greater than 0.03 percent are presented.
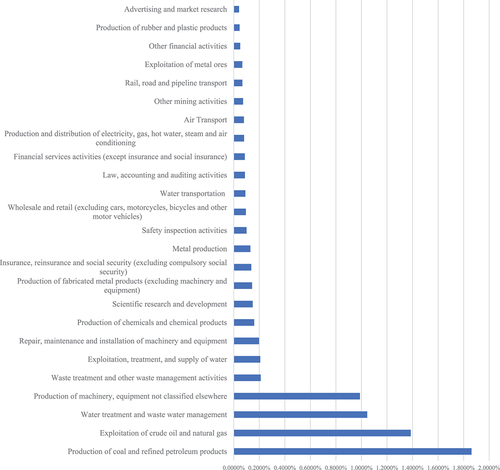
Table 5. Indirect price and expenditure effects by sector (in percent)
Table 2. Share of household expenditure on different goods and services for living by household income quintile (in percent)
Table 6. Indirect expenditure effects by quintile, rural and urban
Table 7. Total direct and indirect expenditure effects by quintile, urban and rural