
Figures & data
Table 1. Economic variables were used
Table 2. Descriptive statistics
Table 3. Matrix of correlations
Figure 1. Economic variables and estimation. Note misalignment of exchange rate equilibrium using the fundamental approach,
exchange rate equilibrium using the fundamental approach,
misalignment of exchange rate equilibrium using the fundamental approach,
exchange rate equilibrium using the HP filter and
misalignment of equilibrium using the HP filter.
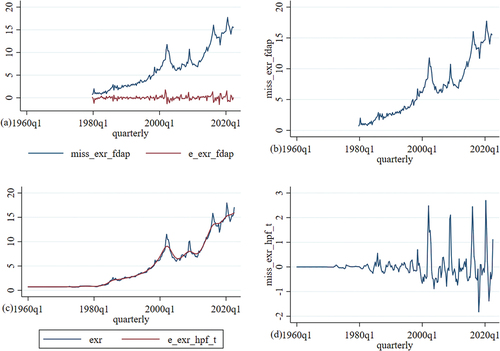
Table 4. Conventional unit root and structural break
Figure 2. Economic variables cluster the first and second waves of volatility. Note that the economic variables, Rand to US Dollar exchange rate,
misalignment of exchange rate equilibrium using the fundamental approach,
misalignment of equilibrium using the HP filter,
and
in each economic variable reflect the cluster volatility.
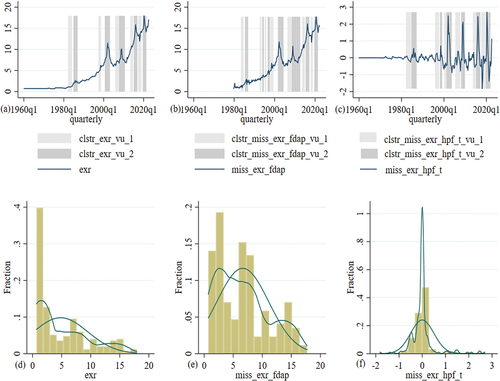
Figure 3. Variance for the exchange rate proxies volatility. Note economic variables exchange rate uncertainty ARCH approach,
exchange rate uncertainty GARCH approach,
exchange rate misalignment uncertainty using the ARCH approach and fundamental approach,
exchange rate misalignment uncertainty using the GARCH approach and fundamental approach,
exchange rate misalignment uncertainty using the ARCH approach and HP filter and
exchange rate misalignment uncertainty using the GARCH approach and HP filter.
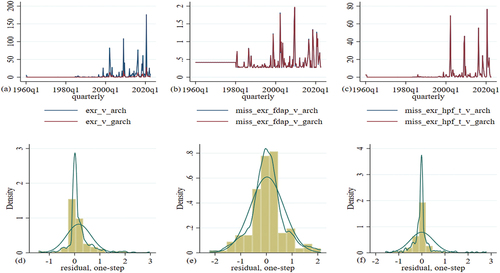
Table 5. ARCH effect test
Table 6. Lag-order selection criteria
Table 7. Johansen tests for cointegration
Table 8. Vector error correction in the short and long run
Table 9. Vector error correction short run
Table 10. Vector error correction long run
Figure 4. Shocks of misalignment of exchange rate equilibrium using the fundamental approach and misalignment of equilibrium using the HP filter. Note that the economic variables are the economic growth,
average capital-labor ratio,
average output-labor ratio,
trade openness,
exchange rate,
government expenditure,
income velocity of circulation of money M1, M2 and M3,
Rand to US Dollar exchange rate,
misalignment of exchange rate equilibrium using the fundamental approach and
misalignment of equilibrium using the HP filter.
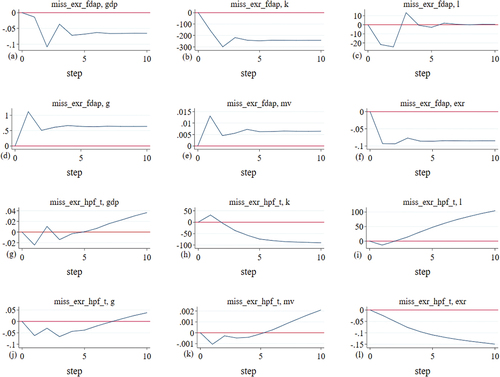
Figure 5. Shocks of exchange rate misalignment uncertainty using the ARCH approach and fundamental approach and exchange rate misalignment uncertainty using the GARCH approach and fundamental approach. Note that the economic variables are the economic,
average capital-labor ratio,
average output-labor ratio,
government expenditure,
income velocity of circulation of money M1, M2 and M3,
Rand to US Dollar exchange rate,
exchange rate misalignment uncertainty using the ARCH approach and fundamental approach and
exchange rate misalignment uncertainty using the GARCH approach and fundamental approach. This result are connect to that of Amor et al. (Citation2023), Ramos-Herrera and Sosvilla-Rivero (Citation2023) and Maku et al. (Citation2023) among other that found is a negative impact of real overvaluation on growth performance, while an undervaluation has no significant impact. investigate the heterogeneous relationship between the per capita economic growth rate and the deviations from the equilibrium exchange rate.
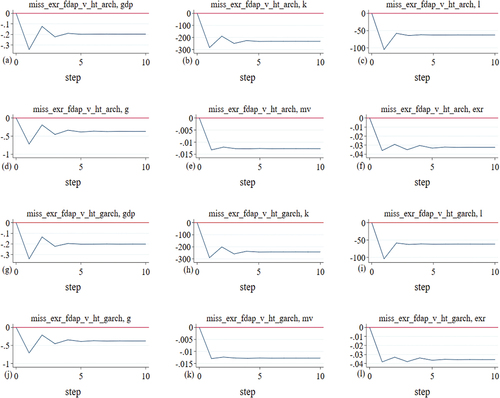
Figure 6. Shocks of exchange rate misalignment uncertainty using the ARCH approach and HP filter and exchange rate misalignment uncertainty using the GARCH approach and HP filter. Note that the economic variables are the economic growth,
average capital-labor ratio,
average output-labor ratio,
exchange rate,
government expenditure,
income velocity of circulation of money M1, M2 and M3,
Rand to US Dollar exchange rate,
exchange rate misalignment uncertainty using the ARCH approach and HP filter and
exchange rate misalignment uncertainty using the GARCH approach and HP filter.
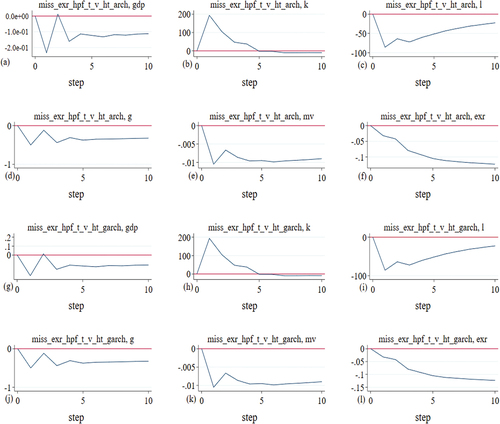
Figure A1. Structural break of the economic variables. The economic variables are the economic growth,
average capital-labor ratio,
average output-labor ratio,
trade openness,
government expenditure,
income velocity of circulation of money M1, M2 and M3 and
Rand to US Dollar exchange rate.
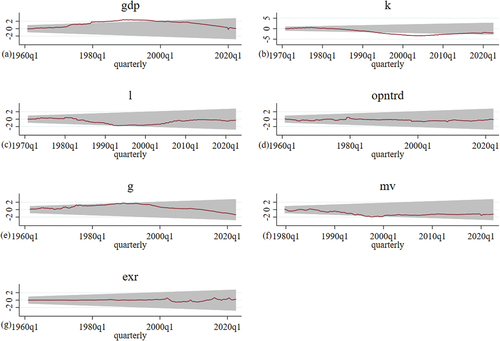
Table A1. Skewness and Kurtosis tests for normality
Table A2. The and
exchange rate uncertainty ARCH and GARCH approaches
Table A3. The and
exchange rate misalignment uncertainty using the ARCH and GARCH approach
Table A4. The and
exchange rate misalignment uncertainty using the ARCH as well as the ARCH approach and HP filter